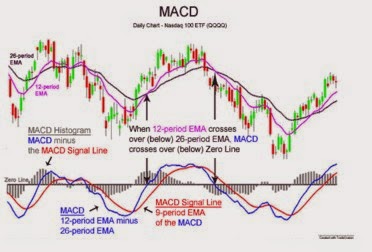
Forex Education Center- Interpretation Forex MACD Indicator,MACD is an indicator of followers symptoms (trend following) and is designed to identify changes in symptoms (trend), and are generally not recommended for use in volatile market conditions. Three forms of trading signals can be obtained as follows:
MACD line crosses the signal line.
MACD line crossing zero.
The difference between price and MACD levels.
Crossing signal is an ordinary trading rules where this is a buy signal when the MACD crossed above signal line break or become a sell signal when the MACD crosses down. This crossing can often happen that other studies should be done to ensure the buy and sell signals.
Histogram shows the crossings when the happens, when the MACD line crosses through zero on the histogram, it can be said that the MACD signal line has been penetrated. This histogram can also help reflection when two lines coming together. Both may still occur but the coming together, so that the histogram that falls can be a sign that the crossing could be approached.
Positive difference between the MACD and price arises when price forms a new low sale price, but the MACD does not establish a new low point. It can be interpreted that the market tends to rise (bullish) where symptoms decrease was approaching. Negative difference is similar, where the price went up but the MACD does not rise as high as before then this means that the market fall (bearish).
It is recommended to use the MACD on the weekly scale before seeing it in the daily scale in order to avoid short-term trade does to the direction of the intermediate frame symptoms.
