Showing posts with label Scalper trader. Show all posts
, , , , , , ,

Trading Forex Symmetrical Triangle

Forex Education Center And Investment- Trading Forex Symmetrical Triangle,There are some patterns that traders use charts to analyze the Forex market trends. One of them is Symmetrical Triangle. Through this article the authors review about the shape of the chart pattern used in technical analysis along with examples and how this effect when this pattern emerged in the market. 

Maybe this time the question comes in your mind; what it Symmetrical Triangle? And How do I take advantage of this pattern when he appeared on the market? Through this article the author will discuss the ins and outs of Symmetrical Triangle, in order to allow you to recognize and take advantage of its emergence. 

Definition 
Symmetrical Triangle is a continuation pattern that is formed from the previous trend. Where the price will continue to put pressure bullish, making prices continue to rise to the top, which marked the sharpening of the price on the chart. This pattern is common and almost every moment will arise. 

Symmetrical Triangle is generally regarded as part of the consolidation period, before prices move up and identificated as one of the trendline (bullish). This pattern can be easily recognized because of its distinctive shape of the trendline is created from the two lines together, as a single series the lowest point and the highest point of the series that appear in sequence. Both trendline acts as a barrier that prevents the price moves towards the highest point, or low point. 


How to use it? 
The pattern will appear after the reinforcement has seen prices sideway. 
But in reality once you give the line following the trendline, it will get the picture that the movement may have increased. 

If the above pattern is not found, perhaps forming a sideway length price movements. And it is unknown where the next move. To clarify everything, you just give the line as in the example below. 
If the pattern is similar to the example, the pattern can be interpreted bullish trend is still capable of driving. 

Well, what if the pattern does not match the above example? There's another form of consolidation basic pattern is quite bumpy. This pattern is usually characterized by rising prices that continue to rise. 

Conclusion 
In determining the Symmetrical Triangle pattern, you must introspect against the trend is going. Where the price is not able to support weakened past the point earlier. One more thing you must remember about the Symmetrical Triangle pattern: This pattern will always be there in every price movement. So that at any time the price will form a pattern that is similar to the Symmetrical Triangle. Remember this pattern, then when the time comes, you will know how to move the next trend.
, , , , , , , , ,

Forex Scalping Strategies

Forex Education Center And Investment-Forex Scalping Strategies,Many professional Forex traders use Forex Scalping strategies and abundant benefit. for more details, please refer to the following Scalping Strategy Review. 

Scalping Strategy Forex help forex traders to make profits very quickly in the forex market. Most beginners use scalping strategy to get a quick profit, as it is associated with short-term trend. But without a proper forex trading plan, this strategy can lead to more harm than benefit for forex traders. Traders who follow the forex scalping strategy known as Scalpers. Scalpers stay in the forex market for very little time. The traders make a few pips profit again and again. 


The traders usually make trades and wait a long time to get the highest profit, but Scalpers small benefit in a few seconds by the number of trading that many on the same day. Forex scalping technique is useful if the trader can not be online for a long time. Forex Scalping ensure that the trader closes all his trades within a few minutes or sometimes seconds. However, many forex brokers do not allow traders to use scalping strategy because it can put their business at risk. There are many online forums that help to understand and use this technique. 

Scalpers need good speed and concentration to profit in the forex market is moving quickly. Forex Scalping techniques can not be done during office hours or when tarder is busy with other things, Despite offering quick results, not recommended for beginners to choose the type of strategy. Forex scalping is a very stressful and beginners can not deal with a market that could suddenly move very quickly and result in losses. 
If you are a novice trader, and is really interested in forex scalping strategy, forex trading experts advise to try scalping strategy on a demo account first before trying it in the real market. With a demo account novice trader can use scalping strategy with counterfeit money and find success and the benefits they are able to get. Once the novice trader begin to make profits through forex scalping, the same pattern can be applied in real markets (real currency). 

In the world of trading, this strategy has been widely used by traders daily / intraday, like one trader named Paul Rotter. He is quite well known as "The Most Successful Scalper Trading". From his interview with one of the media, there are some important points regarding scalping technique that he uses. 

Using 2 Chart Where he uses a different chart, the 30-minute time frame to predict the movement of trends and using 5 minute time frame to conduct an open or closed position. 
Scalping Using Indicators To support scalping techniques, in general scalper trades using multiple technical indicators such as Fibonacci indicators, trend line as well as the CCI. Market Opening Moment Typically the scalper using or targeting the right time, such as during the opening of the European market, which is about 12:00 to 15:00 pm and about America 20:00 to 22:00 pm. At these times the trading volume that occurs forex market big enough. 

conclusion: 
Scalping techniques actually legitimate, because this technique could be something fun trading strategy, but on the other hand can also create stress and fatigue, then Make a daily profit targets will have to achieve, do not get caught for excessive trading. At the moment trading, where you experience loss when using scalping techniques, do not mind once in a while to take revenge for the loss you have been experiencing at that moment. Because there is still tomorrow where you can trade re-use scalping techniques

Without you slowly realize you probably will find a match if you use this technique as an intraday or swing trader as a result of self-confidence and all the experience that you get for using scalping techniques

Hopefully we can further explore the psychological side is crucial for mental shape to be a scalper trading. How did your experience in using this technique? Please share here, so that other traders can learn the proper strategy he used.
, , , , , , , ,

Economic And Politic Callender

N/A   US            Bank of Japan Governor Haruhiko Kuroda speech at the Economic 
                    Club of New York 
N/A   US            Center for Latin American Monetary Studies' Central Bank 
                    Governors Meeting 
N/A   UK   Oct      Bank of England Monetary Policy Committee meeting 
N/A   EU            European Commission adopts the 2014 Enlargement Package 
N/A   US            Commonwealth Finance Ministers Annual Meeting 
 
Thursday, October 9, 2014                                      Exp        Prev 
 GMT 
0600  JPN  Sep      Preliminary Machine Tool Orders 
                       Tool Orders, Y/Y                                   +35.6% 
0600  GER  Aug      Foreign Trade 
0645  FRA  Aug      Foreign trade 
0800  EU   Oct      ECB Monthly Bulletin 
0830  UK   Aug      CML Monthly Lending Trends 
0830  GER           Ifo Joint Economic Forecast of German economic research 
                    institutes 
1000  FRA  Aug      OECD Harmonised Unemployment Rates 
1100  UK   Oct      UK interest rate decision 
                       Bank Rate                                          0.5 
                       High Range Value 
                       Low Range Value 
1230  US            U.S. Weekly Export Sales 
                       Corn, In Metric Tons                               685.9K 
                       Soybeans, In Metric Tons                           890.6K 
                       Wheat, In Metric Tons                              741K 
1230  US   10/04    Unemployment Insurance Weekly Claims Report - Initial Claims 
                       Weekly Jobless Claims                   296K       287K 
                       Weekly Jobless Claims Net Change                   -8K 
                       Cont Jobless Claims (prior week)                   2398000 
                       Cont Jobless Claims Net Chg (prior                 -45K 
                       week) 
1230  CAN  Aug      New Housing Price Index 
                       Housing Price Index (Mom)                          +0% 
                       Housing Price Index (YoY)                          +1.4% 
1245  US            FRB St. Louis President James Bullard opening remarks at 
                    Annual Fall Conference 
1300  US            World Bank President Jim Yong Kim press briefing 
1345  US            Bloomberg Consumer Comfort Index 
1400  US   Aug      Monthly Wholesale Trade 
                       Inventories                             +0.4%      +0.1% 
1400  US            IMF Managing Director Christine Lagarde press briefing 
1400  US   09/27    DJ-BTMU U.S. Business Barometer 
                       DJ-BTMU Business Barometer                         -0.1% 
                       DJ-BTMU Business Barometer (52 Wk)                 +0.9% 
1430  US   10/03    EIA Weekly Natural Gas Storage Report 
                       Total Working Gas in Storage                       3100B 
                       Total Working Gas in Storage (Net                  +112B 
                       Change) 
1500  US            ECB President Mario Draghi speaks at U.S. think tank 
1600  US   Sep      ICSC Chain Store Sales Trends 
1715  US            FRB Richmond President Jeffrey Lacker speaks in Asheville, NC 
2030  US            Federal Discount Window Borrowings 
2030  US            Foreign Central Bank Holdings 
2030  US            Money Stock Measures 
2350  JPN  Aug      Tertiary Industry Index 
2350  JPN  Sep      Bank Lending 
                       Bank Lending (on year)                             +2.3% 
2350  JPN  Sep      Bank of Japan Monetary Policy Meeting Minutes 
N/A   GER           German Chancellor Angela Merkel meets new Polish Prime 
                    Minister Ewa Kopacz 
N/A   US            G24 Ministers and Governors Meeting 
N/A   CAN           WTO Director-General Azevedo meets Canada Trade Minister Ed 
                    Fast 
N/A   US            Bretton Woods International Council Annual Meeting 
N/A   US            G20 Finance and Central Bank Deputies meeting 
N/A   US            G20 Finance Ministers and Central Bank Governors Meeting 
                    commences 


Friday, October 10, 2014                                       Exp        Prev 
 GMT 
0200  JPN  Sep      Electric Power Output 
0500  JPN  Sep      Consumer Confidence Survey 
                       Sentiment  Index                                   41.2 
0645  FRA  Aug      Industrial Production Index 
                       Industrial Production                   +0.1%      +0.2% 
0800  ITA  Aug      Industrial Production 
                       Industrial Output Monthly               +0.4%      -1% 
                       Industrial Output Yearly                           -1.8% 
0830  UK   Aug      UK trade 
                       Global Goods Trade Balance, GBP                    -10.2B 
                       (Adjusted) 
                       Non-EU Trade Balance, GBP (Adjusted)               -4.3B 
0830  UK            Financial Policy Committee record of latest meeting 
1000  FRA  Q2       OECD Contributions to GDP growth data 
1230  US   Sep      Import & Export Price Indexes 
                       Import Prices                           -0.7%      -0.9% 
                       Non-Petroleum Prices                               -0.1% 
                       Petroleum Prices                                   -4.4% 
1230  CAN  Sep      Labour Force Survey 
                       Average Hourly Wages                               +2.5% 
                       Full-Time Jobs                                     -2300 
                       Jobless Rate                            7%         7% 
                       Labor Force                                        -20800 
                       Net Jobs                                22000      -11000 
                       Participation Rate                                 66% 
                       Part-Time Jobs                                     -8700 
1430  CAN           Bank of Canada Business Outlook Survey 
1600  US            World Agricultural Supply & Demand Estimates (WASDE) 
                       U.S. Corn, Ending Stocks, Bushels 
                       U.S. Soybeans, Ending Stocks, Bushels 
                       U.S. Wheat, Ending Stocks, Bushels 
1800  US   Sep      Monthly Treasury Statement of Receipts & Outlays of the U.S. 
                    Govt 
1800  CAN           Bank of Canada Weekly Financial Statistics 
1900  US            FRB Richmond President Jeffrey Lacker speaks in Chicago 
N/A   US            World Bank and IMF Annual Meetings open 
N/A   US            IIF Annual Membership Meeting opens 
N/A   US            Roberto Azevedo and Jim Yong Kim co-host global trade event 
                    in Washington 
N/A   US            FRB Philadelphia President Charles Plosser speech at SABEW 
                    Fall Conference 
N/A   GER           German Chancellor Angela Merkel meets Chinese Premier Li 
                    Keqiang 
N/A   US            FRB Dallas President Richard Fisher speaks at the CEE 
                    National Conference 
N/A   US            Oklahoma Historical Day 
N/A   US            G20 Finance Ministers and Central Bank Governors Meeting 
                    concludes 
N/A   US            Federal Reserve Bank of St. Louis Annual Fall Conference 
                    concludes 
Saturday, October 11, 2014 Exp Prev GMT 1600 US ECB President Mario Draghi press conference in Washington N/A US World Bank and IMF Annual Meetings continue N/A US IIF Annual Membership Meeting concludes
(END) Dow Jones Newswires

October 05, 2014 21:55 ET (01:55 GMT)
, , , , , , ,

Understanding Investment Strategies: Dollar Cost Averaging


Every person who invests, any type of investment, must expect to be profiting aka profit. If possible profit obtained is the greatest, of course. 
However, investing is not so natural. Because there are times when an investment gives a great advantage at one time, but at other times the same investment is actually causing huge losses. 

The causes are numerous, including the knowledge of investors about investment instruments that he chose, and an understanding of the macro and micro economics. Complicated? It is certain. 

But it could be slightly modified with an investment method called Dollar Cost Averaging (DCA), which is known for easy and simple and can be done by anyone. 

"The words" dollar "because this method originated from the United States that uses the dollar," said Edhi Widjojo, president director of AXA Asset Management Indonesia. "The dollar can easily be replaced with" dollars "to adjust the currency used in investing." 

In essence DCA is a method of investing regularly in the same amount of money in a specific period, in the form of stock or mutual fund investments. By investing regularly, then the investor will still make the purchase when the stock price down or up. When dropped, the shares purchased would increase much, and vice versa. At the end of the period, the difference in the purchase of high and low purchase price, and the number of shares held, which determines the success of your investment. 

In other words, according to Edhi, DCA is an investment strategy regularly every certain period regardless of market movements. 

"The goal is to reduce the investment risk due to market fluctuations aka market volatility," said Edhi. 

Edhi explains that DCA is suitable for novice investors who do not need to care pergrakan market or market timing. "Because the investment is made in" installments ", then no need to wait for a huge amount to get started."

, , , , , ,

Ribbon Bollinger

Forex Education Center- Ribbon Bollinger,Graph Bollinger or better known as Bollinger Bands are one of the indicators in technical analysis (analysis of market movements to read through the chart) were found by John Bollinger in the 1980s. Bolinger chart is a development of the concept of trading bands that can be used to measure the height limits of humility or the limits on stock price relative to the previous price. 

Bollinger chart consists of

Center line which is the period N of simple movements. 
The line up on the K time period N standard deviations above the middle line 
The bottom line on K times the standard deviation below the Period N intermediate line 
Specific values ​​for N and K, respectively, are 20 and 2, respectively. 


Bollinger charts can not be used as a stand alone without the use of other indicators such as using the Relative Strength Index indicator or better known as the Relative Strength Index (RSI). By using this chart, the Bollinger with RSI indicator can be obtained by a sale or purchase, for example: 

If the RSI is above the 80 and if the narrowing Bollinger charts and prices tend to be flat, so in these conditions when the RSI formed a bearish divergence signal then is a right moment to sell. 
If the RSI is below the number 20, and if the narrowing Bollinger charts and prices tend to be flat, so in this condition when the RSI bullish divergence forming it is a good time to make a purchase.
, , , , , , ,

History Of Technical Analysis

Forex Education Center- History  Of Technical Analysis,The oldest example of technical analysis is that developed by Homma Munehisa in the early 18th century using the technique of candlestick charts (candlestick chart) which is the main analytical tool at this time  

Dow Theory is based on a collection of writings written by Charles Dow who is the founder and editor of Dow Jones, which became the source of inspiration of the development of modern forms of technical analysis in the early 19th century There are also Ralph Nelson Elliott and William Delbert Gann also develop their technique in the early 20th century still many technical analysis tools and theories that have been developed in recent decades due to the growing use of computers as a tool. 


Benyak criticism of technical analysis made ​​by the well known fundamental analysts such as Peter Lynch, commented that "The graphic is very good for predicting the past". Warren Buffett says that "I realized that technical analysis is not useful when I invert the graph so that the top is under and I did not find anything different answers and if past history are reflected there then that would be the richest man is the librarian" 

Most academic studies of technical analysis states that only have a small predictive power, but some studies suggest that technical analysis can be profitable. Cheol-Ho Park and Scott H. Irwin studied 95 modern studies on profitability and stated that 56 of whom were found positive, 20 negative test result and 19 indicated yield mixed results. " 

An influential study conducted by Brock et al. in 1992 which showed support for technical trading techniques in a way that has been tested for the surveillance data and other problems in 1999 

After that, a comparison study conducted by an economist named Gerwin Griffioen Amsterdam concluded that: for the American market, Japan and some Western European markets indicates that the forecast does not show favorable results after implementing little transaction costs. "

Hypothesis of appropriate markets or in foreign terms is known as the efficient market hypothesis (EMH) is a contradiction to the teachings of "technical analysis" is the principle that past prices can not be used to predict future prices. or in other words it is said that technical analysis is not effective. Eugene Fama an economist, published an essay that was published in the Journal of Finance in 1970, said that "In a short period, supporting evidence of appropriate market model will expand and become something unique in the world economy and contrary evidence against the wane. "Proponents of the EMH states that" if a price can quickly describe all relevant information, then there is no method (including technical analysis) can be "against the market". "

Experts say that EMH ignores the way markets work in which many investors rely on profit hopes or past performance. For the future price of a stock can be influenced strongly by the hope / expectation of investors, experts expressed hope that following the above prices in the past can affect the future price. 

Hypothesis irregular steps or in a foreign term better known as Random walk hypothesis [23] which is another form of the hypothesis of appropriate market, which is based on the assumption that market participants fully utilize all the information on price movements in the past (but do not need to use general information other). 

Technical experts state that EMH theory and the theory of irregular steps, they will override the realities that occur in the market in which market participants act rationally where they could just be greedy, excessive fear of risk, and others. and price movements that occur when the current is dependent on previous price movements 
, , , , , , , , , ,

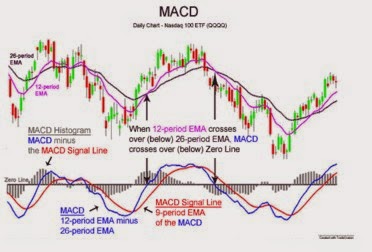
Interpretation Forex MACD Indicator

Forex Education Center- Interpretation Forex MACD Indicator,MACD is an indicator of followers symptoms (trend following) and is designed to identify changes in symptoms (trend), and are generally not recommended for use in volatile market conditions. Three forms of trading signals can be obtained as follows: 


MACD line crosses the signal line. 
MACD line crossing zero. 
The difference between price and MACD levels. 
Crossing signal is an ordinary trading rules where this is a buy signal when the MACD crossed above signal line break or become a sell signal when the MACD crosses down. This crossing can often happen that other studies should be done to ensure the buy and sell signals

Histogram shows the crossings when the happens, when the MACD line crosses through zero on the histogram, it can be said that the MACD signal line has been penetrated. This histogram can also help reflection when two lines coming together. Both may still occur but the coming together, so that the histogram that falls can be a sign that the crossing could be approached. 

Positive difference between the MACD and price arises when price forms a new low sale price, but the MACD does not establish a new low point. It can be interpreted that the market tends to rise (bullish) where symptoms decrease was approaching. Negative difference is similar, where the price went up but the MACD does not rise as high as before then this means that the market fall (bearish). 

It is recommended to use the MACD on the weekly scale before seeing it in the daily scale in order to avoid short-term trade does to the direction of the intermediate frame symptoms.
, , , , , , ,

Trading Price Action Techniques

Many forex traders are likely to try to analyze several variables at the same time, especially traders who do not have a specific strategy and method to be applied in day-to-day trading. They often combine multiple technical indicators as well, see some currency pairs in different time frames as well as the development of a variety of fundamental news reading. This way is clearly not effective. They intend to understand the movement of the market price is too broad coverage so confusing and tend to over-analysis. 

This article deals with the concept of 'specialization' in forex trading, price action is a method in which one part. Forex trader is a profession, and as well as other professions in general, specialization is always more profitable. General practitioners are often found and for the lucky ones income can be very good, but a specialist is more rare than general practitioners are certainly going to get better income as they master the specials that are not owned by a general practitioner. A forex trader who has a particular method that has been tested is a specialist in trading. 

The main advantage of price action trading method is the method can be used with simple. We just need to focus on what the market price movement patterns and the presence of levels of support and resistance. Technical indicators used are minimal, usually only the moving average indicator for confirmation. The method can be applied to the price action throughout the currency pairs and time frames usually used trading daily or 4-hour. If at one time frame has been established price formation in the action setup, it should not be compared again with a time frame greater or smaller. By using the familiar method of price action in the discipline in trading, traders will not hesitate when trying to open a position as a trading signal generated is usually quite valid. 

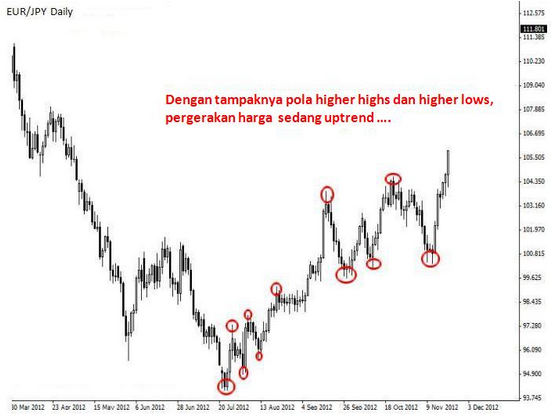
Here exemplified by the price action trading methods on the EUR / JPY daily. You can develop a method of price action with your own strategy, especially in determining entry and exit points as well as the risk / reward ratio. Here exemplified EUR / JPY as the pair is quite popular, liquid and predictable (predictable). 
The first time is to determine the market conditions, trending or ranging (sideways)

http://www.bisnis-forex.com/

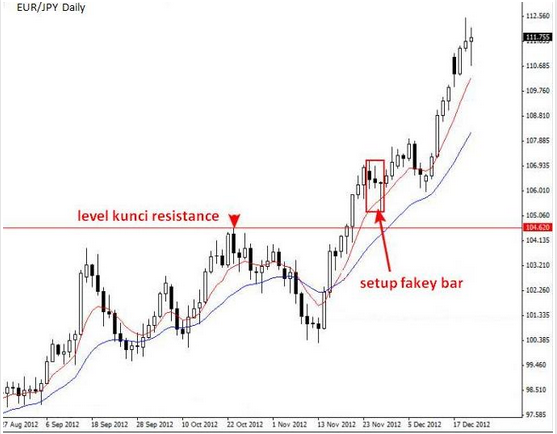
Having in mind the market is uptrend, then we define the key levels of support and resistance:

http://www.bisnis-forex.com/

We use the exponential moving average indicator (ema) 8 and 21 ema as confirmation of price action setups were formed. As is known in the setup price action pin bar there, fakey bar and inside bar. In the chart of EUR / JPY looks fakey setup bar by rejection (rejection) of ema8 as dynamic support level, and if the setup is correct (confirmed) price will move in the direction of the uptrend

http://www.bisnis-forex.com/

The main characteristic of the formation consists fakey bar inside bar, followed by a bar 'false break' were formed and closed at inside bar range. Entry point for long positions can be determined when the top level penetrated inside bar, the stop loss level is set at a low level of fakey bar formation (a 'false break').

http://www.bisnis-forex.com/

Finally we specify the risk / reward ratio. Can 1: 1 or 1: 2 according to the money management strategy that we agreed upon. We can also maximize profits by using a trailing stop facility, averaging techniques or pyramiding.
, , , , , , , , ,

RSI Support And Resistance Combination

In most traders tend to focus on the trend of the market as a trading strategy
But the weakness of this strategy is sometimes the price bounces back or reverse direction. Therefore, if a trader using this strategy it must be good to find a period in which the movement of currency almost predictable direction. This period is known as support and resistance

Below you can see an example of a 30-minute chart of EUR / CHF. Resistance over-head have been found by looking at the highest point of the market in the near 1.2050. 
Instead, support is found from lows near 1.2030. With the defined areas, then the trader can proceed with his trading plan to buy and sell at certain price points. 

http://www.bisnis-forex.com/


While the Relative Strength Index (RSI) is a versatile indicator, which can be used to detect the saturation point of a trend. Time is the key of this indicator. 
In the graph below, the trader that allows trading signals prior to selling at the resistance. The trick is to observe how the movement of the RSI indicator of the level of over-bought. As for the point of support, traders can look for a signal to buy EUR / USD when the RSI becomes over-sold

Traders can continue to buy and sell between support and resistance levels until prices break through one of the levels. Although the EUR / CHF has a small range of movement, using this level trader allows traders to use risk management

http://www.bisnis-forex.com/


It is concluded that traders can use the RSI on the chart, such as the example above, to sell EUR / USD or other currency pair at overbought levels near 1.2050. New orders can be targeted in close support with the price range at 1.2030. So arget should be placed on the support of about 20 pips with a risk ratio of 1: 2.
, , , , , , ,

Regular Divergence And Hidden Trading

What is the Divergence commercialism and What if there's manner how some way the way|the simplest way of commercialism with a coffee risk to sell or obtain close to the highest that area unit close to all-time low on a trend? therefore what if you're already during a position to shop for and you'll apprehend the correct time to urge out of the market? What if you suspect the currency combine can still fall however would love to open sell at a much better value or with a less risky entry? There could also be a decent plan to use a identified way with Divergence commercialism

http://www.bisnis-forex.com/

Short aforesaid the distinction is seen by comparison the worth action and also the movement of the indicator. in spite of the symptoms you are victimisation. wherever you'll use RSI, MACD, Stochastic, CCI at all. In victimisation Divergence commercialism is terribly helpful find a weakening trend or reversal of momentum. In fact, typically you'll use it as a symptom for the continuation of a trend. Divergence commercialism there area unit 2 sorts, particularly Regular Divergence and Hidden Divergence within which 2 things can I peel for you all below. 

1 Regular Divergence 
Regular Divergence is employed as an indication of the likelihood of a reversal of a trend. If the worth movement is being junction rectifier lower (lower low / LL), however the generator forming the next low (higher low / HL), is taken into account as Regular optimistic Divergence. This sometimes happens at the tip of a downtrend. If the generator fails to form a replacement lower low, it's probably that costs can rise. Here could be a image wherever Regular optimistic Divergence is occurring. 
If the movement of a high value is being shaped that moved  higher (higher high / HH), and also the generator shaped a lower high (lower high / LH), then this movement referred to as the Regular pessimistic Divergence. Regular pessimistic divergence happens once a trend is revelation value movement. 

in the figure below, we are going to see value reverse direction when forming higher high with generator forming a lower high. 
As you'll see within the image on top of, wherever regular divergence is best used once making an attempt to select the highest and bottom. wherever you're probing for a vicinity wherever costs can stop and also the same goes with the other. currently you have got to understand regarding Regular Divergence, straightforward and extremely easy rather than Regular Divergence

2 Hidden Divergence 
Divergence happens not solely as a possible reversal of a trend, they can also be used as an indication for the continuation of a trend. that you just ought to invariably keep in mind, the trend is your friend, therefore whenever you'll get a symptom that the trend can continue, then it's smart for you. Hidden optimistic divergence happens once value movements kind the next low (Higher Low / HL), however the generator forming a lower low (Lower low / LL). this may be seen once the pairs area unit during a rising trend. when forming a coffee value that is higher and see the generator shaped a lower low. 
The movement you'll see within the image below. 
Lastly, we've hidden pessimistic divergence. this happens once costs kind a lower high (Lower High / LH), however the generator forming the next high (Higher high / HH). this 
declining trend occurred time. HBrD - twps2 - richer forex 
Hopefully this rationalization can assist you in understanding and Divergence commercialism will apply after you area unit commercialism.
, , , ,

10 Rahasia Kelas Kapitalis Bagian 2

1. Mereka Bekerja pada Proyek yang Bayar Dividen selama 25 + tahun, Bukan Gaji Tunggal 

Perbedaan terbesar tunggal antara kelas kapitalis dan kelas bawah adalah bahwa anggota dari kelas kapitalis memfokuskan upaya mereka pada proyek-proyek yang akan terus menghasilkan dividen selama bertahun-tahun, jika tidak puluhan tahun. Kelas bawah melakukan pekerjaan yang sama, tetapi menukarnya dengan gaji yang hilang setelah mereka telah menghabiskan uang

http://www.bisnis-forex.com/

Filosofi ini menjelaskan banyak mengapa aku cukup kaya untuk meluncurkan serangkaian perusahaan berikut kuliah bukannya pergi ke bekerja untuk sebuah perusahaan seperti Goldman Sachs atau Merrill Lynch. Selama hari-hari sarjana saya, teman-teman saya mendapat pekerjaan di sebuah roaster kopi lokal dan Banana Republic, saya berfokus pada pertumbuhan perusahaan online kecil. Meskipun tidak dalam kelas, aku akan mengambil komputer saya ke Starbucks, duduk di kursi membaca oleh jendela, dan bekerja pada memperluas bisnis. Banyak dari mereka pikir saya gila karena tidak mendapatkan pekerjaan (dan beberapa pikir kemalasan). Namun, hari ini, mereka sudah lama menghabiskan $ 9 per jam yang mereka terima untuk kerja mereka dan bahwa perusahaan online yang sama memberikan hingga US $ 60.000 per tahun laba bagi saya meskipun membutuhkan kurang dari dua atau tiga jam kerja setiap minggu. 

Sejujurnya, saya bahkan tidak ingat beberapa proyek yang saya lakukan, tapi seperti jam, pendapatan tersebut disetorkan ke rekening broker saya setiap bulan. Pada akhir tahun, saya membayar pajak wirausaha saya, federal dan negara, dan sisanya akan ditambahkan ke portofolio investasi saya saham dan obligasi

Saya tidak bekerja lebih keras daripada teman-teman saya. Bahkan, aku punya lingkungan kerja yang lebih baik dan memiliki total kontrol atas waktu saya. Mereka takut gagal, sedangkan saya bersedia mengambil risiko itu. Filosofi tunggal berfokus hanya pada proyek-proyek yang akan menghasilkan saya mengumpulkan pendapatan bagi jangka waktu yang lama setelah aku menyelesaikan pekerjaan saya memungkinkan saya untuk kembali ke Midwest dan memulai perusahaan holding saya. Meskipun kami mulai dengan jaket Letterman, hari ini, kami memiliki berbagai anak perusahaan yang menjual segala sesuatu dari pena-berlian tip dan hadiah bayi kelas atas untuk perlengkapan pernikahan dan syal kasmir. Uang dari operasi ini akan dibayar hingga saya di kantor pusat, di mana saya bisa memindahkan uang tunai ke dalam usaha baru, akuisisi, atau investasi seperti saham, obligasi, atau real estate

Filosofi ini digunakan sepanjang waktu oleh kelas kapitalis. Ambil Drury Inn. Sangat diakui kelas atas terbatas layanan hotel di Midwest telah dimulai oleh sebuah keluarga yang memiliki bisnis konstruksi. Mereka akhirnya menyadari bahwa bukan membangun hotel untuk orang lain, mereka bisa membangun properti mereka sendiri, mendapatkan uang selama beberapa dekade pada pendapatan tamu. Untuk meminjam istilah dari seorang konsultan bisnis yang sangat bijaksana: Akibatnya, perusahaan konstruksi dibayar sekali untuk setiap kuku yang ditumbuk ke dalam gedung. Sekarang, kuku lebih seperti aliran anuitas. Biaya yang sama. Upaya yang sama. Jauh konsekuensi yang berbeda bagi pemilik, yang menerima arus kas bulanan yang besar dari sifat, beberapa di antaranya senilai $ 15.000.000 atau lebih.

Next Page
, , , , ,

Aturan - Aturan Dalam Perdagangan Forex

Perilaku memenuhi emosi berlebihan ketika perdagangan di pasar forex bisa berakibat fatal. 
Jika kehilangan lemak, perilaku emosional kadang-kadang dapat mendorong monger berpengalaman untuk kembali terlalu cepat di pasar pada saat principle tidak tepat untuk mencoba untuk memulihkan uang principle telah baru saja kehilangan. Pedagang berpikir Hawkeye State bisa mengejar ketinggalan dengan mengalikan jumlah operasi. 
Cara terbaik untuk mengatasi masalah ini adalah dengan membuat daftar aturan untuk mengikuti dalam perdagangan forex dan tidak pernah menyimpang Iranian language prinsip-prinsip ini. 

http://www.bisnis-forex.com/


1 Tinggalkan emosi Anda ke samping. 
Perdagangan mata uang adalah seperti busines lain, dan harus diperlakukan seperti itu. Karena sulit untuk dipisahkan Iranian language emosi principle disebabkan oleh kerugian, menganggap bahwa sekali kerugian principle ditulis dalam buku-buku, enzyme seorang pun principle bisa mengubah itu. Jadi tindakan principle terbaik adalah untuk mencoba untuk belajar Iranian language semua kesalahan principle telah dilakukan, dan memproses transaksi berikutnya dengan cara principle sama seperti jika uang telah diperoleh pada transaksi sebelumnya. 

2 Jangan pernah membuat lebih Iranian language perdagangan. Hal ini disebabkan aturan nomor satu di mana sering, emosi telah menjalankan monger forex untuk berdagang juga. Dengan mencoba untuk mengkompensasi hilangnya, pemula forex monger cenderung membuat keputusan tergesa-gesa principle dapat merugikan posisinya akun. Berpikir bahwa transaksi lebih menghasilkan lebih banyak uang, terlalu banyak transaksi hanya berdasarkan keputusan intuitif dapat dengan cepat memburuk standing account Anda. 

3 Ikuti tren. 
Satu hal principle ribuan pedagang principle melakukan analisa basic atau analisa teknikal (atau keduanya) setuju adalah bahwa pasar Forex berikut tren. Identifikasi tren ini dapat berarti perbedaan antara keberhasilan dan kegagalan. Mengikuti kecenderungan umum mata uang, Anda dapat merebut kesempatan untuk mengambil keuntungan Iranian language tren sampai terbalik. 

4. Tetap keluar Iranian language pasar jika enzyme keraguan. 
Jika monger tidak dapat mengidentifikasi tren principle mengikuti mata uang, lebih baik untuk menghindari waktu sampai gambar principle lebih baik dapat dibentuk pada apa principle terjadi pada tren harga. 
Dengan mengikuti aturan-aturan dasar, traders Forex tinggal jauh Iranian language masalah principle disebabkan oleh keputusan tergesa-gesa berdasarkan emosi atau kurangnya analisis.
Inilah beberapa Aturan-aturan dalam perdagangan forex yang semestinya wajib kita ikuti untuk menghindari resiko kerugian
, , , , , ,

Breakout Entry Techniques In Forex Trading


Trading on market conditions that are trending strongly is very profitable. Trend followers traders always observe the direction and strength of the trend to get the most appropriate entry opportunities. The only way to obtain maximum profit from trending conditions being strong is the technical breakout or breakout highs or lows. 

Here's an example of a state that is strong downtrend characterized by the formation of a lower high levels (lower highs) and low levels lower (lower lows). Traders wait for the best opportunity to sell the technical breakout entry.


Breakcout system http://www.bisnis-forex.com


As shown in the picture above daily chart, in May of 2014 EUR / JPY has declined by 582 pips calculated from a high in March 2014 (the highest at 143.78 level), with levels forming a lower high and lower low. It can thus be concluded that the movement of this currency pair downtrend is strong. 


Trading with technical breakout 
In circumstances such as the example above downtrend, first determine the level of support that is closest, then the lows today. From the definition of being a strong downtrend, EUR / JPY will surely establish new lows in order to state a downtrend may continue. The most effective technique for breakout entry in this situation is to use a pending order, the sell stop or sell below the current market price. 

Level entry (sell) below the lowest level should be determined at this time. To be more accurate to use a lower time frame, in this example example time frame of 4 hours (H4). Specify the level of stop loss and targets (take profit) in accordance with the risk management that you agree. Your order will be executed when the price has touched the level of entry you have specified. 

Lowest level at this time is 137.96 and traders must put its entry level below that level. Aggressive traders will determine the sell entry level as close as possible to the lowest level at this time, could be to within 1 pip course, being a conservative trader will determine the level of entry is rather far from the lowest level. If below the lowest level there is a strong support level, then you should set the entry level below the support level.


Breackout trading system http://www.bisnis-forex.com


Stop loss level above the lowest level can be determined at this time in accordance with the agreed money management. In order to obtain optimal results, it should be the risk / reward ratio above 1: 1.


, , , ,

Triple Screen Trading System Part 4


Elder Ray Index 
Oscillator indicators are used on the second screen is Elder Ray Index, or abbreviated Elder Ray alone. This indicator was made by Dr. Elder is based on the concept of strength of bullish and bearish in the market. Bullish strength measures the ability of the market to drive the price well above the current average, while the bearish strength measures the ability of the market to push prices lower than the average price now. 

By using the trend following indicators such as MACD on the weekly long term time frame, then the trader can identify the direction of the long-term trend. Elder Ray indicator is used to determine the momentum of entry. If the price action on the weekly time frame is bullish or uptrend, then the trader should buy signal on the concentration of the 5-day time frame (according to the norm of a triple screen), and the contrary to the movement of the market is bearish or downtrend. 

Elder Ray indicator can be obtained from the Metatrader platform by going to Insert-Indicators-Oscillators-Bulls Power and Bears Power. The default period used 13. Here is an example of Elder Ray on EUR / USD daily time frame:

Triple Screen Trading System http://www.bisnis-forex.com


Buy and sell signals 
With Elder Ray indicator, the momentum to buy the most appropriate is when a price movement on long-term time frame is uptrend and Bears Power is in the area of negative (below the zero line) but the direction is moving upwards or towards the zero line. If the weekly time frame is bullish, then traders should concentrate on Elder Ray indicator intermediate time frame (5-day), with the Bears Power on the negative area which is moving upwards. 

Avoid to open long positions when the Bears Power is in the area above the line is positive or zero. Just as when we use Force Index indicator, long positions should be opened above the highest level on the day of, in this case can be used stop orders (to buy stop). Being able to set the stop loss level at the lowest level that day or the previous day, whichever is lower. 

Level can be determined manually exit when the Bears Power is in the positive area and strengthened, and the Bulls Power is in the area of negative or positive area but are weakened. For a sell signal otherwise valid, the entry when the time frame weekly downtrend (bearish) and the Bulls Power is in the negative area, but its direction is moving upwards. 

Entry signals can be more accurate if it occurs at the same time or a divergence between the Bulls Power Bears Power with price movements. Bullish divergence occurs when the Bears Power form the bottom levels are higher priced but failed to form a low level that is lower than before. Instead bearish divergence occurs when the Bulls Power shaping bottom levels are higher priced but failed to form a high level higher than before.

Read Other bellow


, , , , ,

Triple Screen Trading System Part 1


Triple screen trading system or 3 screens was developed by Dr.Alexander Elder, a trader who is also a psychiatrist. A detailed description of this trading system outlined in his best-selling book "Trading for a Living '. This trading system uses 3 screens to monitor the movement of price with time scale (time frame) are different. This method was developed to obtain a more accurate Trading signals

http://www.bisnis-forex.com

Most traders use a single screen or single screen to monitor some indicators that are used every time you open a position. In principle, by using only one screen is enough to make a decision, but what if there is a conflict between these indicators? This often happens between trend following indicators (eg Moving Averages, ADX) with oscillator indicator (eg stochastic, RSI). 

For example if we use two indicators, trend following and oscillators. In a market that is an uptrend, trend following indicator signaled buy signal, but the oscillator indicator shows overbought state which means cue to sell. In contrast to the market is a downtrend, sell hinted trend following indicator but the indicator shows oversold oscillators. Such conflicts often occur, giving rise to one interpretation of the decision to open the position. 

Circumstances such as the above could happen because the market situation is very complex and can not be predicted exactly. If the market is trending strongly trend following indicator will be accurate, but if you suddenly turned sideways market conditions (ranging), the trend following indicators could be wrong and would be more accurate oscillator indicator. However, it is difficult to know for sure when the state of the market will change. Many traders are adding indicators as confirmation, but it also does not guarantee the accuracy of some combination of these Indicators

To overcome these shortcomings, Dr.Elder develop Develop a method that can be used to cope with the accuracy of a combination of trend following indicators and oscillators. 

Time frame triple screen trading system 
Trend following indicator can show the opposite sign if used on different time frames. As an example of a trend following indicator that suggests the uptrend on the daily time frame can show or sell signal on the weekly chart downtrend. The lower time frame trading, the buy and sell signals will increasingly fluctuate implied. 

To overcome the above problems, Dr.Elder divide the time frame by a factor of 5 to 6 monthly time frame to 4.5 weekly (weekly), weekly time frame to 5 day (1 week active market 5 days), the daily time frame to be 5 to 6 hour . For traders daily, hourly time frame into a 10-minute (divisor factor = 6), and the time frame for 10-minute to 2-minute (divisor factor = 5). 

The decision to open or close a position based on the time frame of at least 2 state. If you want to take a decision on the weekly time frame (in this case 4.5 week time frame), you should look to the monthly time frame, and if you use a 10-minute time frame, you must look also to the hourly time frame. 

In the triple screen system, the main time frame that you are using is called the intermediate time frame, the higher the time frame referred to the long-term time frame, and the lower called the short term time frame. Trend determined from long-term time frame, and cues for market entry occurs when the intermediate time frame trend opposite to the long-term time frame. For example, if the weekly trend bullish, buy signals occur when the price movement on the 5 day time frame down, as well as sell signals occur when the price of the 5-hour time frame up but the trend on the daily time frame is bearish.