Showing posts with label analisa teknikal. Show all posts
, , , , , ,

Analisa Teknikal USD/CAD Hari ini

Forex Education Center And Investment-Analisa Teknikal Harga USD/CAD Hari ini,USD /СAD Analisa gelombang dan proyeksi 17,10-24,10: Uptrend terus. 

Perkiraan pivot point adalah pada tingkat 1,1080. 

Pendapat kami: Beli pasangan di atas tingkat 1,1080 dengan target 1,14-1,15. 

Skenario alternatif: Breakout dan konsolidasi harga di bawah tingkat 1,1080 akan memungkinkan pasangan untuk melanjutkan penurunan ke level 1,10-1,09. 

Analisis: Agaknya, pembentukan iv gelombang keempat dari tingkat senior telah selesai. Lokal tampaknya bahwa harga akan mundur dan kecil satu-dua satu dua gelombang sedang terbentuk. Jika asumsi ini benar dan harga tidak memecah tingkat kritis 1,1180, pasangan ini kemungkinan untuk naik ke tingkat 1,14-1,15 dalam gelombang kelima.

http://www.bisnis-forex.com/

http://www.bisnis-forex.com/
 Demikianlah Analisa teknikal USD/CAD Hari ini,semoga memberikan manfaat untuk anda
Get Adobe Flash player
, , , , , , ,

Analisa Harga USD/JPY Hari ini

Forex Education Center And Investment- Analisa teknikal USD/JPY Hari ini,USD / JPY Analisis Wave dan proyeksi 24,10-31,10: Kenaikan pasangan telah kembali. 

Perkiraan pivot point adalah pada tingkat 106,17. 

Pendapat kami: Beli pasangan dari koreksi atas tingkat 106,17 dengan target 110,00-111,00. 

Skenario alternatif: Breakout dan konsolidasi harga di bawah tingkat 106,17 akan memungkinkan pasangan untuk terus penurunan ke level 104.50. 

Analisis: Agaknya, pembentukan "bearish" koreksi sebagai gelombang keempat 4 dari (5) telah selesai dalam segitiga diagonal berkembang dalam gelombang kelima dari tingkat senior. Lokal, yang pertama satu-dua satu-dua gelombang yang terbentuk. Jika asumsi ini benar, masuk akal untuk mengharapkan bahwa pasangan akan tumbuh dalam gelombang akhir kelima bintang 5 dari (5) ke level 111,0.

http://www.bisnis-forex.com/

http://www.bisnis-forex.com/

Nah seperti diatas itulah gambaran Analisa teknikal harga USD/JPY Hari ini semoga memberikan manfaat untuk anda
, , , , , , ,

Analisa Harga USD/CHF Hari ini

Forex Education Center And Investent- Analisa harga USD/CHF Hari ini,USD / CHF Analisis Wave dan proyeksi 24,10-31,10: Pasangan ini kemungkinan akan tumbuh. 

Perkiraan pivot point adalah pada tingkat 0,9390. 

Pendapat kami: Beli pasangan dari koreksi di atas tingkat 0,9390 dengan target 0,97-0,98. 

Skenario Alternatif: Beli pasangan dari koreksi di atas tingkat 0,9390 dengan target 0,97-0,98. 

Analisis: Agaknya, pembentukan koreksi lokal sebagai gelombang keempat 4 telah selesai. Secara lokal, satu-dua satu-dua momentum sebagai gelombang pertama sedang terbentuk dan jika asumsi ini benar, ada kemungkinan bahwa setelah selesainya koreksi kecil (ii), harga bisa naik dalam gelombang kelima ke tingkat dari 0,97-0,98. Tingkat kritis untuk skenario ini adalah tingkat 0,9390.

http://www.bisnis-forex.com/

http://www.bisnis-forex.com/

Demikianlah Analisa teknikal harga Usd/CHF Hari ini semoga memberikan manfaat untuk anda
, , , , , ,

Analisa Harga GBP/USD Hari ini

Forex Education Center And Investment- Analisa Harga GBP/USD Hari ini,Analisis Gelombang GBP / USD dan proyeksi 24,10-31,10: Penurunan pasangan ini kemungkinan akan berlanjut. 

Perkiraan pivot point adalah pada tingkat 1,5870. 

Pendapat kami: Beli pasangan dari koreksi di atas tingkat 1,5870 dengan target 1,6380-1,64. 

Skenario alternatif: Breakout dan konsolidasi di bawah level 1,5870 akan memungkinkan harga melanjutkan penurunan ke level 1,58-1,57 dalam "bearish" tren. 

Analisis: Sesuai dengan pola gelombang yang ada dari bawah gelombang kita dapat mengasumsikan bahwa gelombang A dari tingkat senior selesai, mengambil bentuk irisan. Secara lokal, tampaknya bahwa pembentukan gelombang B telah dimulai dan dalam wave ini ada satu-dua satu-dua momentum (a) dan koreksi untuk itu (b). Jika asumsi ini benar, setelah selesainya gelombang (b) diharapkan bahwa harga akan naik hingga tingkat 1,6380-1,64. Tingkat kritis untuk skenario ini adalah 1,5870.

http://www.bisnis-forex.com/

http://www.bisnis-forex.com/
 Inilah Analisa GBP/USD Hari ini semoga memberikan manfaat
, , , , , , ,

Berita Gold Hari ini

Forex Education Center And Investment- Berita Gold Hari ini,Sahabat Trader Diseluruh dunia,hari ini kita akan mencoba melihat arah pergerakan harga untuk GOLD terhadap Mata uang Dollar,akan seperti apa pergerakannya dichart market yang ada didepan kita.Kita akan mengintip sedikit tentang itu 

Langsung saja kita melihat Hasil analisa teknikal seperti gambar dibawah ini


http://www.bisnis-forex.com/


Bila sebelumnya kita sudah melihat hasil analisa harga pasangan ini akan kemana,seperti yang disini,nampaknya harga emas sudah waktunya menjawab analisa sebelumnya.
Setelah semat diwarnai aksi Reborn kemarin kini nampak jelas bahwa harga emas terhadap dolar tidak mampu lagi untuk menaiki level harga yang lebih tinggi dari itu dan nampaknya level resistance sudah tercapai.Sebelumnya kita prediksikan emas akan mengalami sedikit kenaikan lebih diatas level yang sudah dicapai ini namun ternyata bila kita lihat sepertinya kekuatannya sudah habis diperjalanan untuk reborn,dan kini saatnya emas akan menuju level dan trend harga sesungguhnya yalitu BEARISH.

Titik pencapaian level harga sudah  tertulis jelas dalam gambar diatas dimana support dan resistancenya sehingga anda akan dapat dengan mudah untuk mendeteksi pergerakan harga  emas tehadap dolar.

Kesimpulanya

XAU/USD Trend = Down,Waktunya untuk melakukan aksi SELL Sampai batasan level yang tertulis dalam gambar diatas.
, , , , , , , ,

Harga Emas Hari Ini

Forex Education Center And Investment- Harga Emas Hari Ini,Untuk analisa harga Emas hari ini maka kita akan mendapatkan pola perjalanan harga yang akan ditempuh oleh komodity ini seperti yang akan nampak dalam gambar dibawah ini.
Analisa ini diambil dengan menggunakan cara analisa teknikal berdasarkan kerangka waktu harian atau Daily.


http://www.bisnis-forex.com/

Seperti yang nampak dalam gambar diatas bahwa ada titik-titik tertentu yang akan dicapai oleh pasangan ini.sepertinya pergerakan harga akan menuju level rsistance pertama,kemudian dia akan menuju tanda panah merah yang ada dibawah,baru setela dari sana dia akan kembali naik menuju pola perjalanan selanjutnya.

Untuk keseluruhan trend Emas nampaknya akan mengalami trend turun terhadap dolar sebagaimana yang nampak dalam garis trend diatas.  

Demikian Analisa Harga Emas Hari ini semoga memberikan manfaat untuk anda

Silahkan di share artikel ini untuk yang lainya
, , , , , , , , ,

Harga Emas Hari Ini

Forex Education Center And Investment- Harga Emas hari ini, adalah bagian dari service yang diberikan oleh Forex Education center dalam rangka membantu mitranya untuk melakukan sebuah analisa terhadap perjalanan harga emas setiap harinya.Anda dapat menemukan analisa harga emas setiap harinya secara gratis

Kami memberikan analisa teknikal untuk berbagai pasangan harga yang akan terjadi diantaranya adalah harga emas.


Nah untuk mempermudah layanan kami kepada anda silahkan segera berlangganan analisa kami setiap harinya dengan gratis


, , , , , , , ,

The movement of the price of EUR / JPY Week

Forex Education Center-The movement of the price of EUR / JPY This week, for the currency pair Eur / Jpy will most likely be moving like in the picture below, There are two time frames that I used to take this technical analysis and the time frame it is H4 and D1 


Based on the H4 time frame then the pair Eur / Jpy will look like this


Based on the H4 time frame then the pair Eur / Jpy will look like this 
Based on the travel patterns for the price of the currency pair EUR / JPY on H4 time frame it can be concluded that the pair will encounter situations reborn after this week hit by some of the down trend, although the strength of this reborn not seem so obvious but it can be read that the pair this money will go to the pattern and the price level starting to get to the actual trend.

The pair have a tendency to go to the price level of 137 655 before he would go back to the real price of travel patterns as seen in the chart below D1


It appears the price chart travel patterns that will be addressed by this currency Pair he will make corrections to the price levels INCREASED by 137. 655 then he will continue his journey to the price level of 133 921 as seen in the image above


The conclusion is

 Now is the right time to make a Buy transaction because the pair will go to 137. 655 price level before he would go to the length of the trend of the price level of 133. 921

Price movement to UP = 137.655
Down to = 133.921

EUR/USD This week analysis Here
, , , , , , , , ,

RSI Support And Resistance Combination

In most traders tend to focus on the trend of the market as a trading strategy
But the weakness of this strategy is sometimes the price bounces back or reverse direction. Therefore, if a trader using this strategy it must be good to find a period in which the movement of currency almost predictable direction. This period is known as support and resistance

Below you can see an example of a 30-minute chart of EUR / CHF. Resistance over-head have been found by looking at the highest point of the market in the near 1.2050. 
Instead, support is found from lows near 1.2030. With the defined areas, then the trader can proceed with his trading plan to buy and sell at certain price points. 

http://www.bisnis-forex.com/


While the Relative Strength Index (RSI) is a versatile indicator, which can be used to detect the saturation point of a trend. Time is the key of this indicator. 
In the graph below, the trader that allows trading signals prior to selling at the resistance. The trick is to observe how the movement of the RSI indicator of the level of over-bought. As for the point of support, traders can look for a signal to buy EUR / USD when the RSI becomes over-sold

Traders can continue to buy and sell between support and resistance levels until prices break through one of the levels. Although the EUR / CHF has a small range of movement, using this level trader allows traders to use risk management

http://www.bisnis-forex.com/


It is concluded that traders can use the RSI on the chart, such as the example above, to sell EUR / USD or other currency pair at overbought levels near 1.2050. New orders can be targeted in close support with the price range at 1.2030. So arget should be placed on the support of about 20 pips with a risk ratio of 1: 2.
, , , , ,

What Is The Trend On Forex Trading

The basic conception of the trend (trend) is incredibly basic stuff during a kind of market-based approaches to the analysis of technical analysis. All the tools used chartist like support and resistance, value patterns, moving average, trendline, etc.. Everything is that the same aim, particularly to help in activity the trend is going on within the market, so as to participate within the trend. you will usually hear the favored terms like "always change the direction of the trend", "never buck the trend", or "the trend is your friend". 

This short article tries to investigate and outline what's meant by trends and classify them into classes. once viewed generally, the trend may be a movement within which direction the market moves. however aside from that we'd like a additional correct definition of their use in technical analysis
All you would like to recollect may be a type of value movements isn't a line in one direction. The market moves within the type of a series of zigzags. Zigzag Movement is forming a series of consecutive waves, with peak (peak / top) and "copy" (through) is pretty clear. Direction peak and throughs it which can verify a market trend that's happening. whereas Peak and thru moving up, down, or sideways (sideways). On Direction movement is what is going to tell United States regarding the market trends

An ascending trend (uptrend) is outlined as a series of peaks and throughs sequence of ascending 
http://www.bisnis-forex.com/

While the downward trend (downtrend) is that the opposite, particularly a series of peaks and throughs of decreasing, the subsequent image of the downtrend
http://www.bisnis-forex.com/

There is conjointly a series of peaks and throughs ar inclined sideways named because the sideways / travel
Well so about a trend in forex trading may provide inspiration for you
, , , , , ,

Risk Management For Long Time Forex Trading

Long-term forex strategy really isn't AN absolute resolution. There also are alternative ways which will be used as your companion in taking advantage. It's simply this general strategy in use by those that don't need to hold enter front of a pc on a daily basis

A long term bargainer can hold a foothold open for a extended amount of your time, can be some days or maybe up to some weeks. shut the new group action is finished if the profit generated was applicable targets. 
http://www.bisnis-forex.com/

advantages 
1 Psychological distress is far smaller. 
No have to be compelled to keep a watch chart a pair of on a daily basis
3 Analysis less complicated, additional towards elementary analysis. 

Disadvantages 
The benefits could also be somewhat longer. 

What would like giant capital? 
Also not, may be adjusted solely. Capital isn't essentially giant. a hundred greenbacks can even be, a vital note ton. 

us take AN example. $ a hundred normal capital account in one of broker 
Lot 0.01 = 0.01 Dollar 
Lot 0.10 = 0.10 dollars 
Lot 1.00 = 1.00 dollars 

You open on patronise one.2998 TP 1.3705 

It seems that the worth fell to one.2663 / 1.2056 / 1.1867 

then his calculations minus is: 
1.2998 to 1.2663 = - 335 pips 
1.2998 to 1.2056 = - 942 pips 
1.2998 to 1.1867 = - 1.131 pips 

How flop Management 
You open the ton zero.01 ($ 0.01) 
Just count your keep. Then you minus: 
-335 Pips x $ zero.01 = $ -3.35 
-942 Pips x $ zero.01 = $ -9.42 
-1.131 Pips x $ zero.01 = $ -11.31 

Please calculate if open with ton zero.02 so on. 
No would like Brobdingnagian capital instead?. ton size becomes key. 

Common Mistakes Long Trams are: 
1 don't concentrate to the best worth / lowest ever. 
2 Open the rear position once more and once more while not calculation. 
3. hedging while not having the ability to induce out. therefore you cornered. 

1. you get risk keharga born lowest ever. 
Up a pair of You SELL risks keharga highest ever. 
3. your advantage reminiscent of that used ton. 
4. your floating Losses proportional to ton that you just use. 

Is there an extended Term Difficulties? 
I think no. Before you get / sell the primary note of the position of the best and lowest worth ever. alter ton to be able to cowl the likelihood that movement happens. Resistance therefore your capital is usually in a very safe level.
, , , , , , , ,

Understanding With Trading Risk Management

This article is excerpted from the writings of impotency Seykota traders on the fundamentals of the idea of risk management in commerce. Seykota commerce mentor UN agency additionally wrote this text to answer the commonly asked queries (frequently asked questions) relating to the applying of risk management in commerce. This paper doesn't review all of the elaborated description that tends impotency Seykota theoretical, however additional to the understanding of risk management briefly and general commerce. 

Risk 
The risk is probably going to be losers. That is, if we tend to purchase a stock at a precise value and there's a prospect that the stock value can go down, then we've got to traumatize the danger. Shares of itself isn't a risk, however it's seemingly to suffer losses owing to purchase these shares could be a risk. As long as we've got stock, or have sure commerce positions, inevitably we are going to be round-faced with the danger. 
http://www.bisnis-forex.com/

The only thanks to manage risk is to shop for or sell shares, gap or closing commerce positions. As long as we've got stock or have a commerce position with the aim of getting a profit, absolutely the risk are some things that we've got to face and may not be avoided. the foremost applicable approach we will do is to manage these risks. 

Managing means that recognizing and dominant. Risk management is that the method of characteristic and dominant the chance of loss. A fund manager can live the danger and increase or decrease the scale of the danger by shopping for or commerce shares, gap or closing commerce positions. 

Examples of the coin toss 
The results of the coin toss can facilitate in understanding the idea of risk management. The likelihood of a happening are some things which will occur as a results of the incident, that is shown by a comparison between the quantity of actual occurrences to the quantity of doable events. If a coin has 2 sides, every of A and B (Up and Down), and also the coin is tossed one hundred times, then fifty times the estimate normally can fall half|partially|partly} A and part B. fifty times the likelihood of half A and half B at massive, that is five hundredth .. detain mind that the likelihood perpetually stood at zero.0 or zero% which implies that it's not possible, to the values ​​of one.0 or 100%, which implies inevitable. 

For example, we tend to bet with the subsequent rules: 

1 Capital bets $ one,000.00 
We bet two coins section A can perpetually seem on every occasion thrown. 
3 If the coin seems the B then we tend to lose and ought to pay $ five.00. 
4 If true and also the A that seems then we are going to acquire 2 time or $ ten.00. 

In this case the likelihood is five hundredth of our profit on every occasion we tend to flip a coin, we are going to derive profit is doubly of that we've got to pay if you lose, or 2: 1, and also the risks we tend to are dissipated the whole quantity of capital or $ one,000.00. 

In the future, or when many shots, then it's seemingly to come up with an oversize enough profit considering the likelihood of profit of fifty with the acquisition quantitative relation 2: one. In trading, coin sections A and B is true and wrong, or profit and loss, could be a comparison of acquisition is that the risk / reward quantitative relation. 
With the acquisition of the next quantitative relation (eg 3: 1), then the profit that we tend to generate are going to be the bigger the likelihood is that the same for (50%). thus by increasing the danger / reward quantitative relation, then the profit that we tend to earn within the long-standing time are going to be bigger.
, , , , , ,

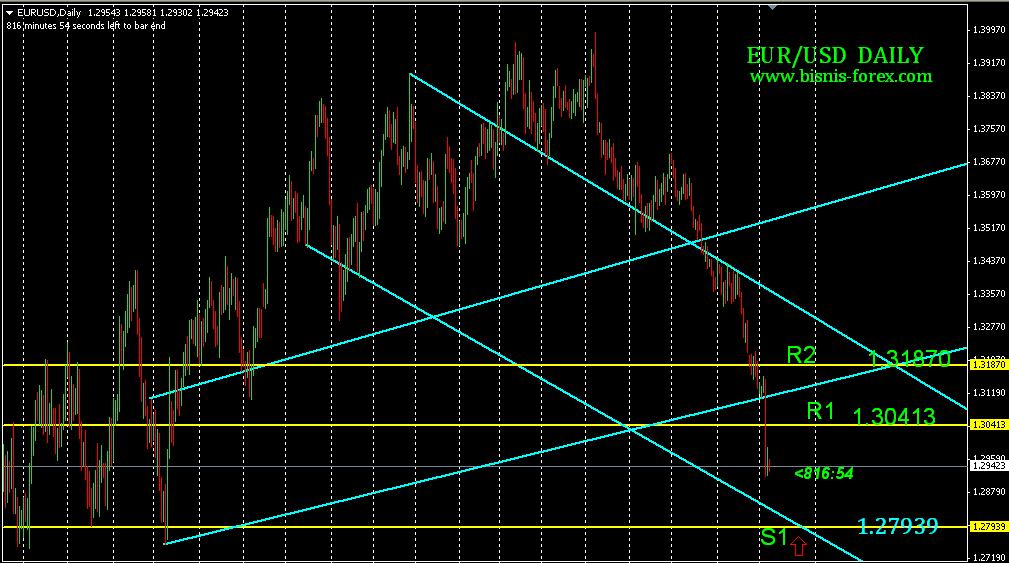
Technical Analysis For Eur/Usd Today


Today I see there will be a pattern of downward price trend is still very strong after a few days before for almost two weeks the pair had a very strong degradation. 
Today is evident in the pattern of the intended travel is still strong to go down although at a smaller time frame will likely trip up there but it is no more merely a correction only way
As seen in the figure below that resistance level 1 for the pair there at level 1.30413, while for level 2 resistance the pair there at level 1.31870

http://www.bisnis-forex.com/

Resistance 1 = 1.30413
Resistance 2 = 1.31870
Support 1 = 1.29423
Support 2 = 1.27 939

According the trend that you can see on that pic above daily trend for this pair is still sell with strong power.
If you are patient then wait the pair correction to the resistance level 1 then you can do a transaction to sell
Conclusion : EUR/USD is still down trend with strong to 1.27939
This is bout Technical Analysis For EUR/USD Today i wish this analysis give you more of benefit s you can make big profit

Note: Remember.....this is just analysis not real market mover so use this analysis with your own risk level on responsibility

Gold analysis Here 
, , , , ,

Daily Technical Analysis For XAU / USD Today

Below I will try to write down what I observed as technically successful in the movement of XAU / USD which will run daily, please try to observe the picture below

http://www.bisnis-forex.com/

When we look at the pattern of the picture above it looks like today is the time used by the XAU / USD is to test the resistance levels towards him at once for a powerful starting point for continuing its journey to the lower level

Possibly on a smaller time frame for this pair show up berdasrakan price patterns that appear daily candle itself but I'm sure the pattern travels up this is only a minimal level of resistance he just ressten 1 and we'll see if he is able to penetrate it is possible to get resistance 2 . 
As in the picture above the point of support and resistance that must be addressed is very clearly illustrated there. 
My conclusion for the pair XAU / USD this is the right time to enter the market with the opening of a trade position to sell

Resistence 1 on 1272.71
Resistence  2 on 1291.40

Support 1 on 1249.04
Support 2 on 1249.50

According trend this pair its so difficult to go up and i see this the good time to SELL on Resistence 1 level

Ok that bout Daily Technical Analysis For XAU/USD Today and i wish this tool is powerful for you and give you more of benefit

EUR/USD Analysis here
, , , , , , ,

How To Trade With Trend Finder Indicator

Transaction tool is kind of completely different from MA. though each have a line, however the performance necessities with accuracy results. many of us World Health Organization claim that the indicator Trend Finder is that the most correct tool at this point. 

What is excellence? will predict trends, is ready to spot the saturated market, and give away to the merchant if the signal has appeared. Anyway we tend to  straightforward to use commerce indicators Indicators Trend Finder. Besides we tend to don't got to predict with laborious, Trend indicators Finder spoil you with alerts. 


Trend indicators classified Finder index. info signal made by the movement of the market. contains a bright color that may distinguish the graph with the signal. The blue color suggests the value is optimistic and pessimistic red reflects. 
For the time-frame tested victimization the m30. the selection of this point frame as a result of not too long to check the indicator offers the signal, however you'll use it on over again frame. however within the time-frame you ought to use giant, the result of false signals is kind of tiny. 

http://www.bisnis-forex.com/


To determine the trend of victimization the signal from the indicator. if the line is on top of, it suggests that the trend down straightaway seem. Conversely, once the road is on top of the blue color is indicative of the trend up can occur. 
Do not forget to mix with the alerts that are provided by the indicator. once costs pass indicator repetitive, examine most of the dominant color of the road on top of. If the red color is dominant within the on top of, it suggests that the trend down is AN open choice position. However, if the dominant blue color, then do the action get. 

http://www.bisnis-forex.com/


conclusion 

Finder Trend indicator will offer a straightforward step in detection the presence of a trend. while not symptom to conduct a study analysis, merely benefit of the Trend Indicator Finder as how to induce the straightforward direction of the trend. Use the Finder Trend indicators as a way of dealings within the future.
, , , , , ,

3 Trading Tips Using RSI

Relative Strength Index (RSI) is one in every of the foremost fashionable indicators and oscillators area unit thought of quite reliable. historically RSI is employed to work out the precise time of entry by trying overbought and oversold levels, in addition as find doable modification of direction of the trend by observant the divergence of the worth movement. Here area unit three tips from traders WHO may be useful in exploitation this indicator. 


1. just in case of a powerful trend, ignore overbought and oversold

When the worth moves trending powerfully in a very comparatively long amount of your time, the tactic of entry by looking forward to overbought and oversold RSI indicator isn't correct any longer. This indicator is created by examination the quantity of positive worth changes or higher with negative worth changes or lower, for a particular amount. The quantitative relation is planned within the vary zero to +100. If when the fundamental quantity has not modified worth movements (such because the sturdy trending), the RSI can stay at overbought conditions (for uptrend) or oversold (for downtrend). 

http://www.bisnis-forex.com/

In the example GBP / USD on top of, the movement of the downtrend is robust and also the RSI stay oversold for long periods of your time. the utilization of strategies to shop for is that the oversold can cause hurt. Before observant the RSI indicator trend traders ought to examine beforehand. Trend strength indicator that's usually used is that the MACD, Bollinger Bands and ADX. 


2. Note the RSI fifty level (center line) 

All indicators oscillators have inferior or center line, sometimes at the amount of fifty, or 50%. Similarly, the RSI indicator. Center line that's usually unnoticed shows the momentum modification of the direction of movement price once retracement, or maybe a modification of direction of the trend. once RSI breaks on top of the middle line within the direction signaled a purchase signal and contrariwise once it penetrates the middle line towards all-time low. 

In the example on top of appearance center line is a price, whereas RSI break the second time, the worth moves downtrend. 

http://www.bisnis-forex.com/


3. the utilization of adjustable parameters with a time-frame of commerce 

Usually the parameters of the default fundamental quantity for nearly all indicators oscillators is fourteen, together with RSI. From expertise, a amount of fourteen appropriate for the daily time-frame, however is a smaller amount correct for the time-frame commerce lower. history on Wilder RSI indicator maker recommends exploitation fourteen periods on the daily time-frame. consistent with Wilder smaller fundamental quantity activity are going to be a lot of sensitive, creating it tough observation, being the bigger are going to be the less sensitive that have an effect on activity accuracy. 

Basically so little  amount settings area unit more and more being generated commerce signals. Daily monger with a one hour time-frame down unremarcabely exploitation the RSI amount nine, and scalpers exploitation amount seven whereas the medium and long run traders use a amount of fourteen or twenty five.

Those bout 3 Trading Tips Using RSI I wish this give you benefit more

Get more rebate from your trade Click here 

, , , , , , , ,

Analysis Of Price Movements Eur / Usd In A Week

It seems that the movement of the currency pair Eur / Usd still have a tendency to take action down. 
Based on the observation that technically there is the potential that the eur / usd will go weekly trend that could have reached the level of the price of 1.27939 (this is the weekly price range). 

As seen in the picture below

http://www.bisnis-forex.com/

1.27939 price level would appear to be a support and a strong purpose for this pair.
Based on the analysis results that appear in the image above is a weekly chat where we can see a tendency down the price is still very strong in this week although there is a bit of a correction that will occur as seen in the daily chart as below


Daily chart

http://www.bisnis-forex.com/

In the daily price chart correction action is likely to be there a little bit towards the price level is 1.32242 which is the strongest resistance levels, if the pair is able to penetrate the potential reborn up will happen but look at both technical and fundamental condition seems to be the weight for the pair

In technical the pair was overwhelming tendency will have come down in price 
This tendency is supported fundamentally the situation is still deteriorating economic conditions and is still associated with the crisis in the Ukraine so that it encourages the weak state of the single currency for the euro area 

Worsening economic conditions and political region helped to trigger the weakening of the euro single currency as traders were still focused on the Ukraine crisis and do the steps carefully in making decisions, this causes the currency of this region is difficult to back up
At least this week the pair eur / usd will still be in a weakened condition as seen in the image above


Thus this Analysis Of Price Movements Eur / Usd In A Week wish this analysis may provide benefits to you


Warning 

This analysis does not warrant the truth 100% even though we've made ​​the best of what we represent so use them wisely and keep trading with your own level of risk

Get Rebates from your trade here
, , , , , , ,

Forecast And Wave Analysis Of 29.08 – 05.09


European currency under pressure. The pair is likely to decline. 

Estimated pivot point is at the level of 1.3220.

Our opinion: Sell the pair below the level of 1.3220 with the target of 1.3040 

Alternative scenario: Breakout and consolidation above the level of 1.3220 will make the price continue the rise to the levels of 1.33 – 1.3350 as part of the senior level correction.

Analysis: Supposedly, the third wave (iii) is still being formed with the impetus extension. It is likely to be completed near the level of 1.3040. If this assumption is correct and the price does not consolidate above the level of 1.3220, it's logical to expect the pair to continue to decline to the levels of 1.31 – 1.3040.
EURUSD H4

http://www.bisnis-forex.com/

http://www.bisnis-forex.com/

EURUSD Dayli

GBP/USD Wave analysis and forecast of 29.08 – 05.09: Downtrend continues.

Estimated pivot point is at the level of 1.6640.

Our opinion: Sell the pair from correction below the level of 1.6640 with the target of 1.64 – 1.63.

Alternative scenario: Breakout and consolidation above the level of 1.6640 will make the price continue the rise to the levels of 1.67 – 1.68 as part of the deep correction.

Analysis: Presumably, the formation of the downward impetus in the first wave of the deep medium-term correction continues. By all appearances, the forming of the local correction in the wave iv is nearing completion. If this assumption is correct and the price does not break down the critical level of 1.6640, the pair will continue to decline to the levels of 1.64 – 1.63.
GPBUSD H4

http://www.bisnis-forex.com/

http://www.bisnis-forex.com/

GPBUSD Daily

USD/CHF Wave analysis and forecast of 29.08 – 05.09: The pair is likely to decline as part of correction.

Estimated pivot point is at the level of 0.9145.

Our opinion: Sell the pair from correction below the level of 0.9145 with the target of 0.9018.

Alternative scenario: Breakout and consolidation above the level of 0.9145 will make it possible for the price to continue the growth to the level of 0.92.

Analysis: Presumably, the formation of the ascending momentum in the third wave (iii) is completed. Locally, a formation of the "bearish" correction in the fourth wave (iv) is not excluded. If this assumption is correct, the pair is likely to decline to the levels of 0.9050 - 0.9020. 

USDCHF H4

http://www.bisnis-forex.com/

http://www.bisnis-forex.com/

USDCHF Daily

USD/JPY Wave analysis and forecast of 29.08 – 05.09: The pair is likely to decline.

Estimated pivot point is at the level of 104.30.

Our opinion: Sell the pair below the level of 104.30 with the target of 101.50 – 101.0.

Alternative scenario: Breakout and consolidation above the level of 104.30 will make it possible for the price to continue the growth to the level of 105.0.

Analysis: On the daily timeframe it is not excluded that the formation of the horizontal correction as the wave (B) is nearing completion. At the moment it is likely that the formation of the wave (C) is completed, within which, by all appearances, a diagonal triangle has formed. If this assumption is correct, it's logical to expect soon a medium-term decline to the level of 99.45 in the wave (C). 

USDJPY H4

http://www.bisnis-forex.com/

http://www.bisnis-forex.com/


USDJPY Daily

USD/СAD Wave analysis and forecast of 29.08 – 05.09: "Bearish" correction is being formed. 

Estimated pivot point is at the level of 1.0998.

Our opinion: Sell the pair from correction below the level of 1.0998 with the target of 1.08 – 1.0760 

Alternative scenario: Breakout and consolidation above the level of 1.0998 will make the price continue the rise to the levels of 1.11 – 1.12 as part of the upward trend.

Analysis: Presumably, the formation of the ascending momentum in the first wave i of 5 of (3) is completed. Locally, a bearish correction is being formed in a form of the wave ii. If this assumption is correct, the pair will continue its local decrease to the levels of 1.08 – 1.0760. 

USDCAD H4

http://www.bisnis-forex.com/

http://www.bisnis-forex.com/

USDCAD Daily


Thats all of Forecast And Wave Analysis Of 29.08-05.09 full wishes it will give you more bennefites

Do you want to make good rebate on your trade..??

Joint Us Here