Showing posts with label Cara Membaca Berita. Show all posts
, , , , ,

Long MA Trading System

Forex Education Center And Investment- Long MA Trading System,This time we will review the system which is basically a very old-fashioned, but is able to be used in all conditions, none other than Long MA trading System. The system is able to detect the long run trend, is also able to detect when it will be oversold or overbought. 

Follow the steps as follows: 


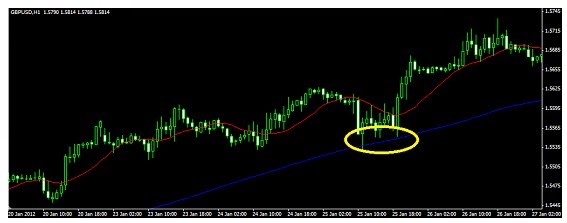
1. Prepare Time Frame H1 (Author using GBPUSD)


2 Prepare the default standard metatrader MA (writer gives blue and red)


MA is colored blue, the period be set to 100


MA in red, gives a chance standards


3 How do open positions: 
Do BUY, if Candlestick was in the MA blue, while the red MA is still above the blue MA


Do SELL, if Candlestick was in the MA blue, while the red MA is still below the blue MA


Not recommended open position when the blue MA in a flat state, given the MA is an indicator that follows the candlestick, use Stop Lose to the anticipation of loss.
, , , , , ,

How Stock Prices Determined

Forex Education Center- How Stock Prices Determined,Price of a stock is determined by market participants based on the demand and supply of the relevant shares in the capital market, where the relationship between price and supply is negative (increased offer price drop), while the relationship between price and demand is positive (increasing demand prices rise ). 


Another thing that affects the supply and demand for a stock of which is the expectation or hope in the future of the company and the issue of performance issues related to the company concerned, giving rise to speculation that is temporary (in the Indonesian capital market just as the stock is known as fried stock ). 

One of the theories about the stock price in the continuous cycle of professional investment is the Efficient Market Hypothesis (EFM), although this theory has been discredited by many widely, both in academic circles and capital markets professionals. In summary, theory suggests that the price of an equity share is price efficient and will tend to follow the movement of randomly determined by the emergence of late-breaking news (randomly) from time to time. Therefore professional equity investors who tend to spend their time immersed in the flow of information is fundamental in order to gain an advantage over their competitors competitors (mainly other professional investors) by more intelligently interpreting the flow of information (news) is emerging. 

EFM theory does not seem to give a complete picture of the process of equity price determination, such as the stock market is more stable than a theory that assumes that the price is the result of the discounted future cash flows expected to be incurred. In recent years it has been realized that the stock market is not perfectly efficient, perhaps especially in emerging markets or other markets in which the level of professional activity (availability of good information) is still lacking. 

Another theory of share price determination comes from the field of Behavior Finance (Finance). In the financial behavior, it is believed that people sometimes make irrational decisions, especially related to the purchase and sale of shares is based on fear and a false perception of an event. Irrational trading can often create stock prices deviate from rational price, which is based on the assessment of the fundamental price. For instance, during the technology bubble that occurred in the late 90s and then burst back in 2000-2002, technology firms are often negotiable far beyond the rational fundamental value because of what is commonly known as the theory of "greater folly ". Stupidity Greater theory states that because the predominant method to realize profits from the sale of shares to other investors, a person should choose stocks that they believe that others will judge these shares at a higher level in the future.
, , , ,

Controversies in the storage of funds directly or through establishment of collective investment

Forex Education CenterControversies in the storage of funds directly or through establishment of collective investment,the biggest advantage of investing in pooled funds are investors access to professional expertise and gain diversification of holdings within the fund. Investors also receive the services associated with these funds as regular written reports and dividend payments (where applicable). The major disadvantages of investing in pooled funds are payable to the managers of such funds (generally must be paid at the beginning and every year and sometimes on exit) and the diversification of the fund that may or may not match the background of the needs of the investors

It is possible to over-diversify. If investors keep some funds, risk and structure of the overall position is an amalgam of storage in all the different funds and arguably the investors to an index or market risk estimates can be made​​. 


Costs or fees paid to professional fund management organization should be monitored carefully. In many cases that is not good (such as fees and other costs which the fee is not visible and hidden in the work environment of the organization) is greater than the payment of dividends and profits after tax returns which investors expect in an average year.

Fundamental Analysis and Technical Analysis 
In the effort to try to identify a good stock for an investment, there are two thoughts: technical analysis and fundamental analysis. The first one is done by studying the history of the stock price and the price history of the stock market as a whole; technical analysts have developed a variety of indicators, some of which are very complex, which is expected to provide useful information in terms of volume and price. Fundamental analysis is done by studying all the relevant information relating to the stocks and market conditions to try to look at the business outlook and future financial development / finance, including the movement of the stock price itself. Fundamental information studied include the financial statements, and any account, industry data (such as sales and order trends) and see the general economic and financial conditions (such as the trend of interest rates).
, , , ,

Investment in equity

Forex Education Center- investment in equity,Equity investments are generally associated with the purchase and storage of capital stock on a stock market by investors, both individuals (individuals) and companies (institutions) in anticipation of income from dividends and capital gain as the value of these shares is increased. It is also sometimes refers to the acquisition of equity (ownership) participation in a private (unlisted) company or a startup (a company being created or newly created). When investments are made in the new company, it is called as a venture capital investment and is generally understood to have a greater risk than investments made in situations where the shares are listed on a stock exchange.


Direct Investments and Funds collected 
Investments can be done directly by the investor in several ways: 

Venture capital investment 
Direct equity investments in companies that have been established and are not listed on the stock market. Usually done to strengthen the financial position of the company, or the company's business expansion can also save oparasional companies due to liquidity problems. 
Direct investments in companies that have been listed on the stock market. In general, the buying and selling of shares is done by using the services of a broker (in Indonesia known as the securities brokerage company), while the trading mechanism established by the authority of the capital market and securities brokerage company in question. 
Indirect investments generally made ​​by individuals through mutual funds or any other form of storage that is specifically from the investment of funds collected, most of them list prices are displayed in financial newspapers or magazines business magazines. 

According to the Capital Market Law number 8 of 1995 Article 1, paragraph (27): "Mutual fund is a container used to collect funds from the public Financier to be invested in portfolio securities by the Investment Manager." 

Mutual funds are typically managed by a fund management company that is well known (eg Fidelity or Vanguard). Such holdings by individual investors an opportunity to diversify risk with little capital and managers have access to the expertise of professional managers in the management of these funds. An alternative usually employed by large investors and institutions (such as large pension funds) is to hold shares directly; in the institutional environment many customers who have their own portfolios have what are called segregated funds in the opposite sense with, or in addition, collected, such as alternative mutual funds.
, , , , , , , ,

MACD Forex Indicator

Forex Education Center- MACD stands for Moving Average Convergence / Divergence (moving average konvergention  / difference), which is a technical analysis indicator created by Gerald Appel in the 1960s. MACD is an indicator for excess buying or selling excess by looking at the relationship between the MA (moving average = moving average) long-and short-term. The MACD line is the difference of 2 MA above. The second line is a line is a sign of the short-term MA of the MACD line. 


MACD shows the difference between the exponential moving average (exponential moving average is commonly abbreviated as "EMA") that rapid and slow closing price. Some development has been done on the MACD for years but still leaves the problem of delay in the indicator, so often criticized for its failure in response to weak market conditions or turbulent. Since the collapse of the market "dot-com" in 2000, most strategies no longer recommend the use MACD as a primary method in the analysis, but only used as a mere observer. Standard period suggested by Gerald Appel in the 1960s is to use the 12 and 26 day periods: 

MACD = EMA  , price - EMA , price 
The signal line or trigger line is formed by refining the formula is then formed by the smoothing this with a further EMA. The standard period for this is 9 days, 

signal = EMA, MACD 
The difference between the MACD and the signal line is often calculated and expressed in the form of lines but not in the form of a histogram containing box. This construction was made by Thomas Aspray in 1986 Method of calculation: 

histogram = MACD - signal 
In the example chart above, shows all three simultaneously. The graph above is the price, which is below the graphs have the blue MACD line and the signal line in red and white in the form of a histogram is the difference between the two. 

The set of periods of average values ​​are usually written as 12,26,9, and may vary. Appel and other analysts have been experimenting with various combinations.
, , , , , ,

Markets Have Memory Pattern

Markets never forget, or rather have memories. By naked eye you can see the levels of support and resistance that proved this. Markets never forget the moments of the start of a significant movement. How many times have you observed price movements experienced a correction and back again to a level or area where the movement started? 
Sometimes prices ranging move around that level before continuing or reverse direction. This incident in the history of repeated movement of any currency pair, and if you understand why this is the case you certainly will not have trouble again in anticipation of market price movements
Forex trading is about probabilities, so it is not like measuring or calculating something definite and absolute. The market will always remember every significant movement he made. It is a high probability but not always. However a high probability can be used as an assumption. 
Clear evidence of the high probability seen in the formation of the bar (candlestick) or the formation of price movements (price action) occurs. Price action is a signal of the direction of the next movement. The combination between the assumptions and the formation of price action can give a clear indication of the price movement and trading signals with a high probability. 

Here's an example of the daily chart stock index DAX30 (Germany):

http://www.bisnis-forex.com/

Key resistance level (key resistance) formed between 9735.00 to 9700.00. Area between the key resistance level and downward price movements are significant in this case referred to as 'events area'. Trading signal does not have to occur at the level of the key, but can also be at the event area. As in this example a pin bar reversal looks formed on the event area is a signal to sell. 

After 12 days of re-formed pin bar reversal in the event area and move the price back down. This suggests that the market is never forgotten and always respect levels and also key events that formed the area. If a trader has understood this then he will be able to anticipate when the signals are formed at levels key events in the area. 

Entry is based price action signals that occur close to the level of resistance or support and event area is usually safer and often true. This is because the situation was confirmed by the memory market.
, , , , ,

Daily Technical Analysis For XAU / USD Today

Below I will try to write down what I observed as technically successful in the movement of XAU / USD which will run daily, please try to observe the picture below

http://www.bisnis-forex.com/

When we look at the pattern of the picture above it looks like today is the time used by the XAU / USD is to test the resistance levels towards him at once for a powerful starting point for continuing its journey to the lower level

Possibly on a smaller time frame for this pair show up berdasrakan price patterns that appear daily candle itself but I'm sure the pattern travels up this is only a minimal level of resistance he just ressten 1 and we'll see if he is able to penetrate it is possible to get resistance 2 . 
As in the picture above the point of support and resistance that must be addressed is very clearly illustrated there. 
My conclusion for the pair XAU / USD this is the right time to enter the market with the opening of a trade position to sell

Resistence 1 on 1272.71
Resistence  2 on 1291.40

Support 1 on 1249.04
Support 2 on 1249.50

According trend this pair its so difficult to go up and i see this the good time to SELL on Resistence 1 level

Ok that bout Daily Technical Analysis For XAU/USD Today and i wish this tool is powerful for you and give you more of benefit

EUR/USD Analysis here
, , , , , ,

Basic Indicators For Short-Term Trading

The many outstanding technical indicators generally usually offer completely different indications. This has caused several users become mistaken in reading the indications. Excessive use of indicators might even cause the user fails to check indications that ought to be seen simply. 

In the rubric mercantilism strategy this month, we have a tendency to raised the employment of two items indicator is taken into account 'basic indicators'. Its use may at the same time generate optimum returns and shorten the amount of the dealings. the indications which will be used on this occasion is that the Bollinger Bands and Moving Average (on a fifteen minute chart). The effective product accustomed wear this indicator is that the major currency pairs like EUR / USD, GBP / USD, USD / JPY and AUD / USD. 

Bollinger Bands area unit a technical indicator created by John Bollinger within the Nineteen Eighties, and was proprietary in 2011. There area unit many ways for market participants in implementing Bollinger Bands, that do purchase once worth touches the lower Bollinger Band (lower limit), and shut the position once the value reaches the point (Moving Average) of the Bollinger Bands. Vice versa, do sell once the value reaches the higher Bollinger Band, and closes the position in its moving average line. however don't stop there, there are also utilized in different ways in which do purchase once costs break higher than the higher Bollinger Band, and sell once the value bust below the lower Bollinger Band to. 

implementation 

But the tactic developed by Mark Larsen, a merchant and research worker derivatives market indicators long struggle with a range of indicators, the employment of Bollinger Bands is to wear a amount of ten and is employed as a reference for market entry. 

Note the fifteen minute chart image below. If the value reaches the lower Bollinger however closed higher than the road, then ensuing worth movement recorded reinforcement, then the worth is a sign of the lower Bollinger. Let the value of re-formed, and once worth closed below the indicated worth, then it becomes a confirmation signal to require an edge purchase / Long (see table one within the figure). 

http://www.bisnis-forex.com/


Conversely, if {the worth|the worth|the value} reaches the higher Bollinger and closed below the last line on ensuing price movement noted weakening, then the worth is a sign of the higher Bollinger. once the re-formed and also the worth goes up, closed higher than the worth indications into a confirmation signal to require an edge Sell / Short (see table a pair of within the figure). 

Level Profit Target 

To close an edge, we have a tendency to use the Moving Average indicator, the road fashioned from the typical worth of many periods. during this technique we have a tendency to use the fourteen amount straightforward Moving Average, that is employed as A level to exit (Profit Target) from our position. the employment of MA fourteen (red line within the figure) is to avoid the loss dealings as a result of we have a tendency to area unit looking ahead to the action of middle Bollinger because the exit level. powerfully suggested to avoid the dealings by mistreatment this strategy once / approaching events / vital news. Given the value movements that area unit too volatile and therefore affects the employment of technical indicators

Stop Loss Level 

It would be nice if each dealings with an affordable risk limits. during this technical study, we recommend to accompany limit risk if {the worth|the worth|the value} drops all the way down to an occasional level / low on the stem or low worth indication from the trunk once we go purchase price. Table one portray cut loss level at an occasional worth stems indication, wherever the low level is not up to the low on the trunk of Associate in Nursing entry level worth purchase signal. Conversely, if {the worth|the worth|the value} rises higher than a high level / high from the rod price indication or high priced rods once we go sell. As seen in Table a pair of that illustrates the cut loss level is at the high worth of entry-level rods sell, as a result of more than high on the stem worth indication. 

The most troublesome factor is to seek out A level indication, therefore expect accuracy and prudence in its determination. Patience in looking ahead to the entry-level is required as a result of generally we have a tendency to specialise in one level indication therefore skip costs that generate signals indicative of the other. It created North American country fail to require advantage of market opportunities that are fashioned. 

Please train your mercantilism strategy on the net mercantilism platform by registering account here 
, , , , , ,

Using Market Indicators To Know Economic Process


The Manager of the System Open Market Account reported  on recent developments in exchange markets. He indicated that the swap limning by the Bank of North American country had been repaid fully on Jan twenty nine, 1996. The Committee sanctioned that group action by unanimous vote.
The Manager additionally reported  on recent developments in domestic monetary markets and on System open market transactions in U.S. government securities and government agency obligations throughout the amount Dec nineteen, 1995, through Jan thirty, 1996. By unanimous vote, the Committee sanctioned these transactions.

http://www.bisnis-forex.com/

The Committee then turned to a discussion of the economic and monetary outlook, the ranges for the expansion of cash and debt in 1996, and also the implementation of financial policy over the inter meeting amount ahead. A outline of the economic and monetary data on the market at the time of the meeting and of the Committee's discussion is provided below, followed by the domestic policy directive that was approved by the Committee and issued to the Federal Reserve System Bank of latest royal house.

Only a restricted quantity of latest data was on the market for this meeting attributable to delays in government releases that that was on the market, together with anecdotal statement, instructed that the economy had been growing comparatively slowly in recent months. client payment had swollen with modesty in any case, growth in business investment in capital product perceived to have slackened somewhat recently, and housing demand appeared to have leveled out. Slower growth in final sales was resulting in inventory build ups in a very few industries and these buildups, along with the disruptions from government shutdowns and severe weather, were having a restraining impact on economic activity. The demand for labor was still growing at a moderate pace, though, and also the percentage remained comparatively low. The recent knowledge on costs and wages had been mixed, however there was no firm proof of a modification in underlying inflation trends.

Nonfarm payroll employment continued  to expand moderately in December; the gain was in line with the common monthly increase for 1995. Employment in producing, boosted by the settlement of a strike at a serious craft manufacturer, reversed the declines of October and Nov. Construction payrolls rose more in Dec, despite unfavorable weather in some elements of the country. Job growth remained solid in abundant of the services business, though employment at personnel offer corporations was very little modified. The civilian percentage remained at five.6 % in Dec.

Industrial production edged up in Dec and for the fourth quarter as a full advanced solely slightly; industrial activity remained sluggish in Jan in keeping with the restricted applied math data that was on the market. In Dec, producing output rose slightly in association with a rise in motorcar assemblies and craft production. Elsewhere in producing, the expansion of output of workplace and computing instrumentality slowed somewhat from the speedy pace of previous months Free Articles, and also the production of defense and area instrumentality and of unserviceable trade goods registered sizable declines. The output of utilities was boosted somewhat in Dec by the impact of colder-than-average temperatures on the demand for heating services. Utilization of total industrial capability fell slightly however remained at a moderately elevated level.
, , , ,

Keltner Channels Dan Saluran Breackout Trading Strategies


Keltner Channel (band Keltner) - merupakan indikator klasik dan analisis teknis yang dirancang oleh Chester Keltner pada tahun 1960. 

Dalam strategi  chanel Keltner ini digunakan untuk menunjukkan volatilitas pasar. Chanel diatur dengan bantuan harga rata-rata yang bergerak (10), dikalikan dengan nilai kisaran ATR untuk menentukan batas atas dan bawah dari chanel Keltner. ATR (Average kisaran true) digunakan untuk mengukur volatilitas dari instrumen perdagangan. 

Untuk menggunakan strategi ini, Anda harus download indikator Keltner Channel, yang secara otomatis akan menarik chanel. Mengubah periode harga rata-rata yang bergerak dari 10 sampai 40 Bila indikator yang anda download itu sudah terminal Trading -> Ahli -> indikator Pasangan yang digunakan untuk perdagangan adalah: EUR / USD, GBP / USD, USD / CHF. 

Kerangka waktu H4 adalah yang digunakan untuk perdagangan. 

Ambil jumlah keuntungan hingga 65 poin. 

Stop-loss sebesar 35 poin. 

Autran main untuk transaksi dengan teknik ini adalah seperti dibawah ini

- Beli posisi dapat dibuka pada saat ketika harga istirahat keluar batas atas saluran Keltner (gambar 1). 

strategy trading trading kalter chanel


- Jual posisi dapat dibuka pada saat ketika harga istirahat keluar batas bawah channel Keltner. (Gambar 2) 

keltner chanel trading strategies

Nah demikianlah tentang Keltner chaner Dan chanel Breackout Trading strategies semoga menambah keuntungan anda dan bermanfaat untuk semuanya
Selamat mencoba dan salam sukses untuk anda
, , , , ,

Foreign Exchange

Forex Education Center And Invetsment- Foreign Exchange Hallo Trader....are you stiil have opinion if forex is same with stck of maket...?? If like that so you must read this one Fore you
The foreign exchange market is also known as the FX market, and the forex market. Trading that takes place between two counties with different currencies is the basis for the fx market and the background of the trading in this market. The forex market is over thirty years old, established in the early 1970′s. The forex market is one that is not based on any one business or investing in any one business, but the trading and selling of currencies


The difference between the stock market and the forex market is the vast trading that occurs on the forex market. There is millions and millions that are traded daily on the forex market, almost two trillion dollars is traded daily. The amount is much higher than the money traded on the daily stock market of any country. The forex market is one that involves governments, banks, financial institutions and those similar types of institutions from other countries. The 


http://www.bisnis-forex.com/

What is traded, bought and sold on the forex market is something that can easily be liquidated, meaning it can be turned back to cash fast, or often times it is actually going to be cash. From one currency to another, the availability of cash in the forex market is something that can happen fast for any investor from any country. 

The difference between the stock market and the forex market is that the forex market is global, worldwide. The stock market is something that takes place only within a country. The stock market is based on businesses and products that are within a country, and the forex market takes that a step further to include any country. 

The stock market has set business hours. Generally, this is going to follow the business day, and will be closed on banking holidays and weekends. The forex market is one that is open generally twenty four hours a day because the vast number of countries that are involved in forex trading, buying and selling are located in so many different times zones. As one market is opening, another countries market is closing. This is the continual method of how the forex market trading occurs. 

The stock market in any country is going to be based on only that countries currency, say for example the Japanese yen, and the Japanese stock market, or the United States stock market and the dollar. However, in the forex market, you are involved with many types of countries, and many currencies. You will find references to a variety of currencies, and this is a big difference between the stock market and the forex market.

, , , ,

Get To Know Who Is Participating In Forex Market Trades

Get To Know Who Is Participating In Forex Market Trades 

Do you know anyone who is involved in forex trading .... ??? 
Do you know how much personal involvement in forex trading .... ??? 
Let us find out about anyone involved in forex trading is very liquid so that we are able to read how much potential for the future in this trade
Have you ever thought who are the actually involved in forex trading this .. ??? Maybe some of us already understand anyone who is involved in forex trading, but do not rule out the possibility of some of us also still deviate above questions that have not found the answer, therefore, is when you want to find the answer, please read this article once and hopefully able to provide insight for you

  The forex market is all about trading between countries, the currencies of those countries and the timing of investing in certain currencies. The FX market is trading between counties, usually completed with a broker or a financial company. Many people are involved in forex trading, which is similar to stock market trading, but FX trading is completed on a much larger overall scale. Much of the trading does take place between banks, governments, brokers and a small amount of trades will take place in retail settings where the average person involved in trading is known as a spectator. Financial market and financial conditions are making the forex market trading go up and down daily. Millions are traded on a daily basis between many of the largest countries and this is going to include some amount of trading in smaller countries as well. 


http://www.bisnis-forex.com/

From the studies over the years, most trades in the forex market are done between banks and this is called interbank. Banks make up about 50 percent of the trading in the forex market. So, if banks are widely using this method to make money for stockholders and for their own bettering of business, you know the money must be there for the smaller investor, the fund mangers to use to increase the amount of interest paid to accounts. Banks trade money daily to increase the amount of money they hold. Overnight a bank will invest millions in Forex markets, and then the next day make that money available to the public in their savings, checking accounts and etc. 

Commercial companies are also trading more often in the forex markets. The commercial companies such as Deutsche bank, UBS, Citigroup, and others such as HSBC, Braclays, Merrill Lynch, JP Morgan Chase, and still others such as Goldman Sachs, ABN Amro, Morgan Stanley, and so on are actively trading in the forex markets to increase wealth of stock holders. Many smaller companies may not be involved in the forex markets as extensively as some large companies are but the options are stil there. 

Central banks are the banks that hold international roles in the Foreign markets. The supply of money, the availability of money, and the interest rates are controlled by central banks. Central banks play a large role in the Forex trading, and are located in Tokyo, New York and in London. These are not the only central locations for forex trading but these are among the very largest involved in this market strategy. Sometimes banks, commercial investors and the central banks will have large losses, and this in turn is passed on to investors. Other times, the investors and banks will have huge gains.


What do you think .. ??? 

It is remarkable large this forex trading and now you can judge what kind of trader would be your next all in your hands

, , , , ,

Effect of Non-Farm Payrolls And Exchange Rates USD


If by chance you are a forex trader is concerned with Fundamental data, then you would know that the data changes in a country's workforce is a key driver of currency exchange of the country. The number of workers can be interpreted also as the number of jobs (job) is available. One of the changes in the amount of data that is always awaited job forex market participants is a data Non-farm payrolls (NFP) United States are usually high impact on the dollar. Many scalpers and day traders who take advantage of the High volatility of the current US NFP data release in order to reap the benefits.

NFP http://www.bisnis-forex.com


Non-Farm Payrolls (NFP) report data on the list is the salary received by American workers in all business sectors except: 
- Employees of the federal government (such as civil servants in Indonesia). 
- Agriculture and plantation workers. 
- A housekeeper (PRT) working on the individual. 
- Worker-profit organization (non-profit) that provides consultation to individuals. 
So salary forex traders included in the list of NFP. 

The report, released each month by the Bureau of Labor Statistics said on Friday the first week also includes the average number of working hours and average earnings per week for part-time workers (part-timers). 

Why US NFP data important? 
NFP data show that the income received by 80% of US workers are an essential contribution to the US's GDP figures. The data is an early indicator for consumer spending and overall economic activity. The Fed and the government to use this indicator to determine the current economic conditions and predict the state of a time when that will come. Policy makers always consider the employment data to make important decisions. 

More and more jobs means that the higher the NFP numbers, and business conditions will increase with increasing investment and recruitment so that the demand will rise. Opposite situation occurs if the NFP numbers down. Benchmark estimates NFP normal rate today is around 200,000 jobs (more or less). Below the figure is usually the unemployment rate will rise, indicating that reduced demand or declining business confidence. Opposite situation occurs for high NFP figures. 

NFP rose means many jobs are created by the number of workers increases. This will cause a rise in consumer demand, and will have a positive impact on the exchange rate USD. So if the numbers go up then NFP USD exchange rate will be higher, if the NFP down USD exchange rate will weaken. 

The impact of the USD is usually dependent on the difference between the actual data (the results of release) and expectations, the data from the consensus of economists and analysts, or estimate. If the actual data is greater than estimates of the USD will rise, and vice versa if the actual data is smaller than expected, the USD will weaken. The greater the difference in the actual data and estimates, the higher the strengthening or weakening of the exchange rate to USD.

That bout Effect Of Non Payrolls And Exchage RAate USD i wish this articel will give you the bennefit

, , ,

Perbedaan Antara Trading Forex Konvensional Dan Binary Option


Sahabat Trader diseluruh dunia.........!!


Gambar up/down binary option http://www.bisnis-forex.com


Pada kesempatan ini saya akan mencoba menuliskan beberapa hal yang mungkin akan menjadi bahan pertimbangan anda untuk memilih atau menentukan apakah anda akan memilih Trading forex konvensioanal atau beralih kepada trading forex dengan cara Binary Option
Ada beberapa hal yang mendasar yang membuat keduanya sangat berbeda mulai dari tingkat keuntungan serta tingkat resiko yang masing-masing ada pada mereka


Forex

- Membutuhkan Margin trading

- Perhitungan Keuntungan menggunakan PIPS atau point untuk menentukan berapa besar keuntungan yang akan didapat

- Terkadang kita menahan posisi Floating

- Untuk menutup posisi kita tidak dibatasi waktu

- Bebas seberapa lama kita dapat menahan posisi terbuka kita asalkan margin anda kuat untuk mengikuti perdagangan

- Keuntungan tergantung seberapa banyak point atau pips yang anda hasilkan untuk tiap posisi,sehingga semakin besar poin plus yang anda hasilkan maka akan semakin besar pula namun sebaliknya semakin besar poin minus anda maka akan semakin besar pula kerugian yang anda harus tanggung

- Bisa dikategorikan sebagai perdagangan jangka panjang

- Hanya ada dua  piliha model transaksi


Binary Option


- Tidak membutuhkan margin trading

- Perhitungan keuntungan tidak menggunakan poin sehingga seberapapun banyaknya point atau sedikitnya poin yang anda hasilkan itu tidak berpengaruh terhadap besar kecilnya keuntungan atau kerugian

- Tidak ada istilah menahan floating

- Transaksi anda dibatasi oleh waktu yang anda pilih sendiri

- Besarnya keuntungan sesuai dengan kontrak anda diawal misalnya 80% untuk sekali transaksi atau sebagainya

- Kerugian anda hanya sebatas apa yang anda investasikan dalam membuka posisi transaksi saja

- Perdagangan jangka pendek

- Banyak pilihan model transaksi 


Melihat Perbedaan Antara Trading Forex Konvensional Dan Binary Option diatas tentu anda dapat menentukan pilihan manakah diantara keduanya yang sesungguhnya menguntungkan untuk bisnis anda.namun demikian tentunya masing-masing memilki kelebihan dan kekurangan masing-masing.

Coba anda tonton video transaksi binary option saya Disini dan semoga tulisan ini memberikan inspirasi untuk anda


Salam
, , , , ,

Technical Analysis 21 july 2014


( Pola harga hari ini )


Salam Kemajuan

Sahabat Trader dibawah ini adalah beberapa Analisa teknikal yang saya ambil pada beberapa Pasangan mata uang dengan menggunakan time frame h4,namun ada satu yang menggunakan time frame H1 karena susah ketika saya mencoba mengambilnya dengan H4.
Analisa teknikal ini akan menunjukkan Pola perjalanan harga seperti yang bergambar dalam garis hijau dalam masing-masing gambar.
Pola yang terbentuk berdasarkan level Support dan Resisten yang mungkin akan dicapai selama perjalanan harga harian.
Selengkapnya silahkan langsung menuju masing-masing gambar dibawah ini


GBP/USD
Nampak dalam pola didalam gambar bahwa harga GBP/USD akan mengalami Trend Naik meskipun dalam gambar akan nampak pola harganya
Secara keseluruhan Trend pasangan mata uang ini adalah Bullish

Gambar analisa teknikal gbp/usd http://www.bisnis-forex.com


EUR/USD
Pasangan mata uang ini sepertinya memiliki tenaga yang cukup kuat untuk Bullish seperti dalam gambar dibawah
Namun kemungkinan akan diwarnai sedikit aksi sideways sebelum mencapai trend yang sebenarnya

Gambar analisa teknikal EUR/USD http://www.bisnis-forex.com


USD/JPY
Pair ini nampaknya juga memiliki trend besar Naik,mungkin ada pelemahan kepada YEN sehingga ini memicu penguatan terhadap USD

Gambar analisa teknikal usd/jpy http://www.bisnis-forex.com


EUR/JPY
Sepertinya pelemahan JPY terjadi tidak hanya terhadap USD namun kepada Mata uang Zona euro juga mengalami pelemahan sehingga kemungkinan Pola harga hari ini akan terbentuk seperti dalam gambar dbawah ini
Ada kemiripan pola antara USD/JPY dan EUR/JPY maka kita lihat saja mana yang berhasil seperti pola gambarnya

Gambar analisa teknikal harga EUR/JPY http://www.bisnis-forex.com


Demikianlah hasil pengamatan saya terhadap beberapa Pasangan mata uang yang akan berjalan hari ini dalam Technical Analysis 21 July 2014,semoga memberikan manfaat
Analisa ini tidak menjadikan  jaminan 100% bahwa harga akan seperti yang nampak dalam pola jadi tetaplah bijaksana dalam menggunakanya.

Tetaplah pada kedisiplinan dalam menjaga tingkat Resiko trading anda masing-masing


Salam kemajuan